Stock Analysis
Even With A 29% Surge, Cautious Investors Are Not Rewarding Oceanus Group Limited's (SGX:579) Performance Completely


Oceanus Group Limited (SGX:579) shareholders have had their patience rewarded with a 29% share price jump in the last month. Unfortunately, the gains of the last month did little to right the losses of the last year with the stock still down 25% over that time.
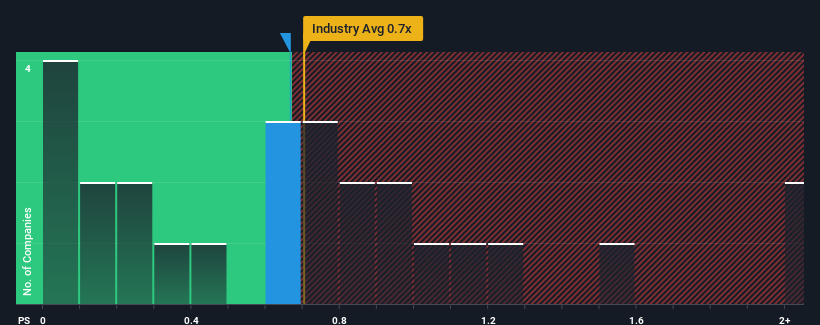
In spite of the firm bounce in price, it's still not a stretch to say that Oceanus Group's price-to-sales (or "P/S") ratio of 0.7x right now seems quite "middle-of-the-road" compared to the Food industry in Singapore, seeing as it matches the P/S ratio of the wider industry. Although, it's not wise to simply ignore the P/S without explanation as investors may be disregarding a distinct opportunity or a costly mistake.
View our latest analysis for Oceanus Group
What Does Oceanus Group's P/S Mean For Shareholders?
With revenue growth that's exceedingly strong of late, Oceanus Group has been doing very well. The P/S is probably moderate because investors think this strong revenue growth might not be enough to outperform the broader industry in the near future. If you like the company, you'd be hoping this isn't the case so that you could potentially pick up some stock while it's not quite in favour.
We don't have analyst forecasts, but you can see how recent trends are setting up the company for the future by checking out our free report on Oceanus Group's earnings, revenue and cash flow.What Are Revenue Growth Metrics Telling Us About The P/S?
Oceanus Group's P/S ratio would be typical for a company that's only expected to deliver moderate growth, and importantly, perform in line with the industry.
Retrospectively, the last year delivered an exceptional 48% gain to the company's top line. The latest three year period has also seen an excellent 276% overall rise in revenue, aided by its short-term performance. So we can start by confirming that the company has done a great job of growing revenue over that time.
Comparing that recent medium-term revenue trajectory with the industry's one-year growth forecast of 5.3% shows it's noticeably more attractive.
In light of this, it's curious that Oceanus Group's P/S sits in line with the majority of other companies. Apparently some shareholders believe the recent performance is at its limits and have been accepting lower selling prices.
The Final Word
Oceanus Group appears to be back in favour with a solid price jump bringing its P/S back in line with other companies in the industry Using the price-to-sales ratio alone to determine if you should sell your stock isn't sensible, however it can be a practical guide to the company's future prospects.
We've established that Oceanus Group currently trades on a lower than expected P/S since its recent three-year growth is higher than the wider industry forecast. When we see strong revenue with faster-than-industry growth, we can only assume potential risks are what might be placing pressure on the P/S ratio. It appears some are indeed anticipating revenue instability, because the persistence of these recent medium-term conditions would normally provide a boost to the share price.
It's always necessary to consider the ever-present spectre of investment risk. We've identified 2 warning signs with Oceanus Group, and understanding these should be part of your investment process.
It's important to make sure you look for a great company, not just the first idea you come across. So if growing profitability aligns with your idea of a great company, take a peek at this free list of interesting companies with strong recent earnings growth (and a low P/E).
Valuation is complex, but we're helping make it simple.
Find out whether Oceanus Group is potentially over or undervalued by checking out our comprehensive analysis, which includes fair value estimates, risks and warnings, dividends, insider transactions and financial health.
View the Free AnalysisHave feedback on this article? Concerned about the content? Get in touch with us directly. Alternatively, email editorial-team (at) simplywallst.com.
This article by Simply Wall St is general in nature. We provide commentary based on historical data and analyst forecasts only using an unbiased methodology and our articles are not intended to be financial advice. It does not constitute a recommendation to buy or sell any stock, and does not take account of your objectives, or your financial situation. We aim to bring you long-term focused analysis driven by fundamental data. Note that our analysis may not factor in the latest price-sensitive company announcements or qualitative material. Simply Wall St has no position in any stocks mentioned.
About SGX:579
Oceanus Group
Oceanus Group Limited, an investment holding company, sells processed marine products, sugar, beverages, and other commodities in Singapore, Hong Kong, Macau, Thailand, and the People’s Republic of China.
Adequate balance sheet and overvalued.
