Stock Analysis
- Australia
- /
- Oil and Gas
- /
- ASX:ALD
Even though Ampol (ASX:ALD) has lost AU$467m market cap in last 7 days, shareholders are still up 84% over 3 years

By buying an index fund, you can roughly match the market return with ease. But if you buy good businesses at attractive prices, your portfolio returns could exceed the average market return. For example, the Ampol Limited (ASX:ALD) share price is up 52% in the last three years, clearly besting the market return of around 7.1% (not including dividends). On the other hand, the returns haven't been quite so good recently, with shareholders up just 37% , including dividends .
Since the long term performance has been good but there's been a recent pullback of 4.7%, let's check if the fundamentals match the share price.
View our latest analysis for Ampol
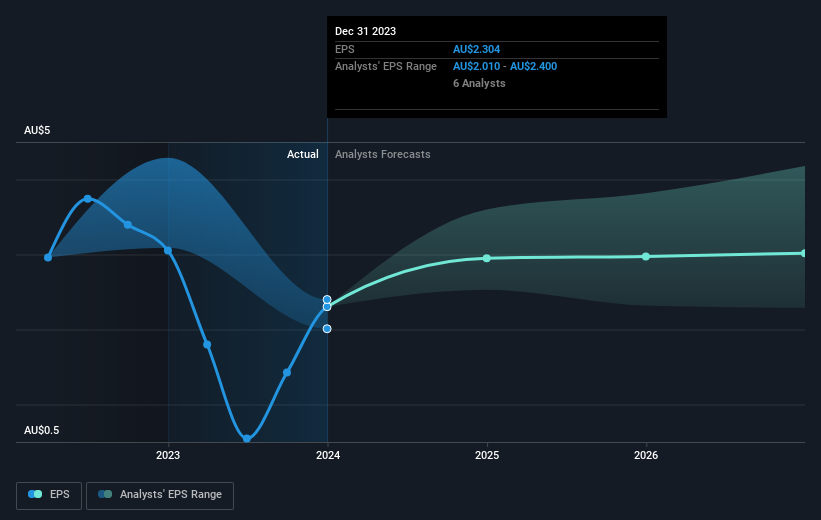
There is no denying that markets are sometimes efficient, but prices do not always reflect underlying business performance. One imperfect but simple way to consider how the market perception of a company has shifted is to compare the change in the earnings per share (EPS) with the share price movement.
Ampol became profitable within the last three years. So we would expect a higher share price over the period.
The graphic below depicts how EPS has changed over time (unveil the exact values by clicking on the image).
We know that Ampol has improved its bottom line over the last three years, but what does the future have in store? Take a more thorough look at Ampol's financial health with this free report on its balance sheet.
What About Dividends?
When looking at investment returns, it is important to consider the difference between total shareholder return (TSR) and share price return. The TSR is a return calculation that accounts for the value of cash dividends (assuming that any dividend received was reinvested) and the calculated value of any discounted capital raisings and spin-offs. Arguably, the TSR gives a more comprehensive picture of the return generated by a stock. We note that for Ampol the TSR over the last 3 years was 84%, which is better than the share price return mentioned above. And there's no prize for guessing that the dividend payments largely explain the divergence!
A Different Perspective
It's good to see that Ampol has rewarded shareholders with a total shareholder return of 37% in the last twelve months. That's including the dividend. Since the one-year TSR is better than the five-year TSR (the latter coming in at 13% per year), it would seem that the stock's performance has improved in recent times. Given the share price momentum remains strong, it might be worth taking a closer look at the stock, lest you miss an opportunity. It's always interesting to track share price performance over the longer term. But to understand Ampol better, we need to consider many other factors. Case in point: We've spotted 2 warning signs for Ampol you should be aware of.
If you like to buy stocks alongside management, then you might just love this free list of companies. (Hint: insiders have been buying them).
Please note, the market returns quoted in this article reflect the market weighted average returns of stocks that currently trade on Australian exchanges.
Valuation is complex, but we're helping make it simple.
Find out whether Ampol is potentially over or undervalued by checking out our comprehensive analysis, which includes fair value estimates, risks and warnings, dividends, insider transactions and financial health.
View the Free AnalysisHave feedback on this article? Concerned about the content? Get in touch with us directly. Alternatively, email editorial-team (at) simplywallst.com.
This article by Simply Wall St is general in nature. We provide commentary based on historical data and analyst forecasts only using an unbiased methodology and our articles are not intended to be financial advice. It does not constitute a recommendation to buy or sell any stock, and does not take account of your objectives, or your financial situation. We aim to bring you long-term focused analysis driven by fundamental data. Note that our analysis may not factor in the latest price-sensitive company announcements or qualitative material. Simply Wall St has no position in any stocks mentioned.

Simply Wall St
About ASX:ALD
Ampol
Ampol Limited purchases, refines, distributes, and markets petroleum products in Australia, New Zealand, Singapore, and the United States.
Adequate balance sheet average dividend payer.
