Stock Analysis
- United Kingdom
- /
- Specialty Stores
- /
- LSE:FRAS
Declining Stock and Solid Fundamentals: Is The Market Wrong About Frasers Group Plc (LON:FRAS)?


It is hard to get excited after looking at Frasers Group's (LON:FRAS) recent performance, when its stock has declined 2.1% over the past week. However, a closer look at its sound financials might cause you to think again. Given that fundamentals usually drive long-term market outcomes, the company is worth looking at. In this article, we decided to focus on Frasers Group's ROE.
Return on Equity or ROE is a test of how effectively a company is growing its value and managing investors’ money. In simpler terms, it measures the profitability of a company in relation to shareholder's equity.
See our latest analysis for Frasers Group
How Is ROE Calculated?
The formula for ROE is:
Return on Equity = Net Profit (from continuing operations) ÷ Shareholders' Equity
So, based on the above formula, the ROE for Frasers Group is:
31% = UK£540m ÷ UK£1.7b (Based on the trailing twelve months to October 2023).
The 'return' refers to a company's earnings over the last year. That means that for every £1 worth of shareholders' equity, the company generated £0.31 in profit.
What Is The Relationship Between ROE And Earnings Growth?
Thus far, we have learned that ROE measures how efficiently a company is generating its profits. We now need to evaluate how much profit the company reinvests or "retains" for future growth which then gives us an idea about the growth potential of the company. Assuming all else is equal, companies that have both a higher return on equity and higher profit retention are usually the ones that have a higher growth rate when compared to companies that don't have the same features.
A Side By Side comparison of Frasers Group's Earnings Growth And 31% ROE
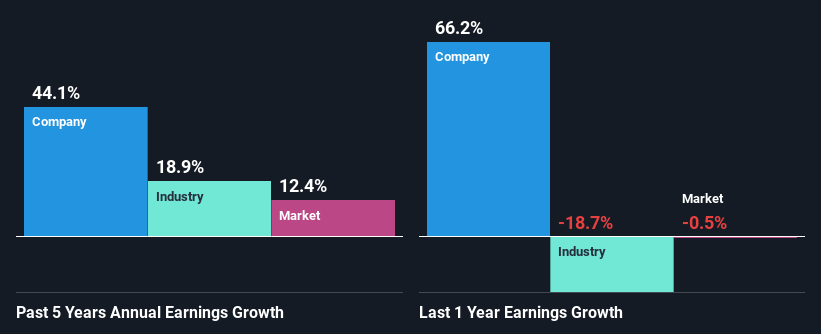
Firstly, we acknowledge that Frasers Group has a significantly high ROE. Additionally, the company's ROE is higher compared to the industry average of 15% which is quite remarkable. So, the substantial 44% net income growth seen by Frasers Group over the past five years isn't overly surprising.
As a next step, we compared Frasers Group's net income growth with the industry, and pleasingly, we found that the growth seen by the company is higher than the average industry growth of 19%.
Earnings growth is a huge factor in stock valuation. The investor should try to establish if the expected growth or decline in earnings, whichever the case may be, is priced in. By doing so, they will have an idea if the stock is headed into clear blue waters or if swampy waters await. What is FRAS worth today? The intrinsic value infographic in our free research report helps visualize whether FRAS is currently mispriced by the market.
Is Frasers Group Making Efficient Use Of Its Profits?
Given that Frasers Group doesn't pay any regular dividends to its shareholders, we infer that the company has been reinvesting all of its profits to grow its business.
Conclusion
On the whole, we feel that Frasers Group's performance has been quite good. Specifically, we like that the company is reinvesting a huge chunk of its profits at a high rate of return. This of course has caused the company to see substantial growth in its earnings. With that said, on studying the latest analyst forecasts, we found that while the company has seen growth in its past earnings, analysts expect its future earnings to shrink. To know more about the company's future earnings growth forecasts take a look at this free report on analyst forecasts for the company to find out more.
Valuation is complex, but we're helping make it simple.
Find out whether Frasers Group is potentially over or undervalued by checking out our comprehensive analysis, which includes fair value estimates, risks and warnings, dividends, insider transactions and financial health.
View the Free AnalysisHave feedback on this article? Concerned about the content? Get in touch with us directly. Alternatively, email editorial-team (at) simplywallst.com.
This article by Simply Wall St is general in nature. We provide commentary based on historical data and analyst forecasts only using an unbiased methodology and our articles are not intended to be financial advice. It does not constitute a recommendation to buy or sell any stock, and does not take account of your objectives, or your financial situation. We aim to bring you long-term focused analysis driven by fundamental data. Note that our analysis may not factor in the latest price-sensitive company announcements or qualitative material. Simply Wall St has no position in any stocks mentioned.
About LSE:FRAS
Frasers Group
Frasers Group Plc, together with its subsidiaries, retails sports and leisure clothing, footwear, equipment, accessories, and apparel through department stores, shops, and online in the United Kingdom, Europe, the United States, Asia, Oceania, and internationally.
Solid track record with excellent balance sheet.
