Stock Analysis
- Poland
- /
- Entertainment
- /
- WSE:CRJ
Creepy Jar S.A.'s (WSE:CRJ) Intrinsic Value Is Potentially 21% Below Its Share Price

Key Insights
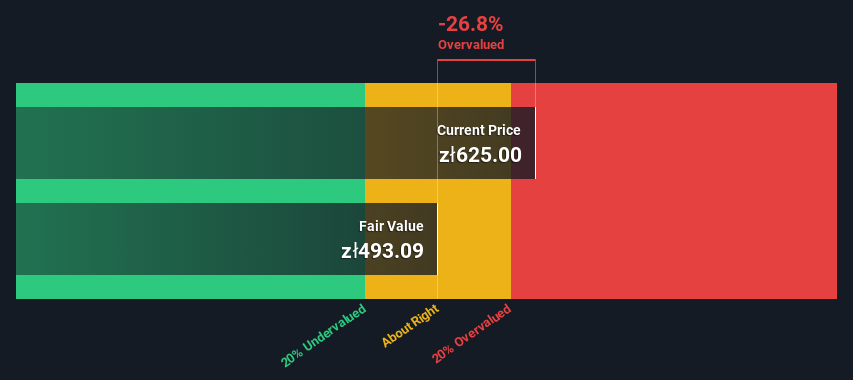
- Using the 2 Stage Free Cash Flow to Equity, Creepy Jar fair value estimate is zł493
- Creepy Jar is estimated to be 27% overvalued based on current share price of zł625
- Industry average of 16% suggests Creepy Jar's peers are currently trading at a lower premium to fair value
How far off is Creepy Jar S.A. (WSE:CRJ) from its intrinsic value? Using the most recent financial data, we'll take a look at whether the stock is fairly priced by estimating the company's future cash flows and discounting them to their present value. This will be done using the Discounted Cash Flow (DCF) model. Models like these may appear beyond the comprehension of a lay person, but they're fairly easy to follow.
Companies can be valued in a lot of ways, so we would point out that a DCF is not perfect for every situation. For those who are keen learners of equity analysis, the Simply Wall St analysis model here may be something of interest to you.
See our latest analysis for Creepy Jar
Crunching The Numbers
We're using the 2-stage growth model, which simply means we take in account two stages of company's growth. In the initial period the company may have a higher growth rate and the second stage is usually assumed to have a stable growth rate. To start off with, we need to estimate the next ten years of cash flows. Where possible we use analyst estimates, but when these aren't available we extrapolate the previous free cash flow (FCF) from the last estimate or reported value. We assume companies with shrinking free cash flow will slow their rate of shrinkage, and that companies with growing free cash flow will see their growth rate slow, over this period. We do this to reflect that growth tends to slow more in the early years than it does in later years.
A DCF is all about the idea that a dollar in the future is less valuable than a dollar today, so we discount the value of these future cash flows to their estimated value in today's dollars:
10-year free cash flow (FCF) estimate
| 2024 | 2025 | 2026 | 2027 | 2028 | 2029 | 2030 | 2031 | 2032 | 2033 | |
| Levered FCF (PLN, Millions) | zł21.4m | zł46.2m | zł42.6m | zł22.2m | zł22.4m | zł22.8m | zł23.3m | zł23.9m | zł24.6m | zł25.3m |
| Growth Rate Estimate Source | Analyst x1 | Analyst x1 | Analyst x1 | Analyst x1 | Est @ 0.82% | Est @ 1.65% | Est @ 2.23% | Est @ 2.64% | Est @ 2.93% | Est @ 3.12% |
| Present Value (PLN, Millions) Discounted @ 9.7% | zł19.5 | zł38.4 | zł32.2 | zł15.3 | zł14.1 | zł13.0 | zł12.1 | zł11.3 | zł10.6 | zł10.0 |
("Est" = FCF growth rate estimated by Simply Wall St)
Present Value of 10-year Cash Flow (PVCF) = zł177m
The second stage is also known as Terminal Value, this is the business's cash flow after the first stage. The Gordon Growth formula is used to calculate Terminal Value at a future annual growth rate equal to the 5-year average of the 10-year government bond yield of 3.6%. We discount the terminal cash flows to today's value at a cost of equity of 9.7%.
Terminal Value (TV)= FCF2033 × (1 + g) ÷ (r – g) = zł25m× (1 + 3.6%) ÷ (9.7%– 3.6%) = zł426m
Present Value of Terminal Value (PVTV)= TV / (1 + r)10= zł426m÷ ( 1 + 9.7%)10= zł168m
The total value, or equity value, is then the sum of the present value of the future cash flows, which in this case is zł345m. In the final step we divide the equity value by the number of shares outstanding. Relative to the current share price of zł625, the company appears slightly overvalued at the time of writing. The assumptions in any calculation have a big impact on the valuation, so it is better to view this as a rough estimate, not precise down to the last cent.
The Assumptions
We would point out that the most important inputs to a discounted cash flow are the discount rate and of course the actual cash flows. Part of investing is coming up with your own evaluation of a company's future performance, so try the calculation yourself and check your own assumptions. The DCF also does not consider the possible cyclicality of an industry, or a company's future capital requirements, so it does not give a full picture of a company's potential performance. Given that we are looking at Creepy Jar as potential shareholders, the cost of equity is used as the discount rate, rather than the cost of capital (or weighted average cost of capital, WACC) which accounts for debt. In this calculation we've used 9.7%, which is based on a levered beta of 1.054. Beta is a measure of a stock's volatility, compared to the market as a whole. We get our beta from the industry average beta of globally comparable companies, with an imposed limit between 0.8 and 2.0, which is a reasonable range for a stable business.
SWOT Analysis for Creepy Jar
- Currently debt free.
- Earnings declined over the past year.
- Dividend is low compared to the top 25% of dividend payers in the Entertainment market.
- Shareholders have been diluted in the past year.
- Annual earnings are forecast to grow faster than the Polish market.
- Good value based on P/E ratio compared to estimated Fair P/E ratio.
- Dividends are not covered by cash flow.
Next Steps:
Whilst important, the DCF calculation is only one of many factors that you need to assess for a company. It's not possible to obtain a foolproof valuation with a DCF model. Rather it should be seen as a guide to "what assumptions need to be true for this stock to be under/overvalued?" For example, changes in the company's cost of equity or the risk free rate can significantly impact the valuation. Why is the intrinsic value lower than the current share price? For Creepy Jar, we've compiled three further elements you should look at:
- Risks: Be aware that Creepy Jar is showing 3 warning signs in our investment analysis , and 1 of those is significant...
- Future Earnings: How does CRJ's growth rate compare to its peers and the wider market? Dig deeper into the analyst consensus number for the upcoming years by interacting with our free analyst growth expectation chart.
- Other High Quality Alternatives: Do you like a good all-rounder? Explore our interactive list of high quality stocks to get an idea of what else is out there you may be missing!
PS. The Simply Wall St app conducts a discounted cash flow valuation for every stock on the WSE every day. If you want to find the calculation for other stocks just search here.
Valuation is complex, but we're helping make it simple.
Find out whether Creepy Jar is potentially over or undervalued by checking out our comprehensive analysis, which includes fair value estimates, risks and warnings, dividends, insider transactions and financial health.
View the Free AnalysisHave feedback on this article? Concerned about the content? Get in touch with us directly. Alternatively, email editorial-team (at) simplywallst.com.
This article by Simply Wall St is general in nature. We provide commentary based on historical data and analyst forecasts only using an unbiased methodology and our articles are not intended to be financial advice. It does not constitute a recommendation to buy or sell any stock, and does not take account of your objectives, or your financial situation. We aim to bring you long-term focused analysis driven by fundamental data. Note that our analysis may not factor in the latest price-sensitive company announcements or qualitative material. Simply Wall St has no position in any stocks mentioned.

Simply Wall St
About WSE:CRJ
Creepy Jar
Creepy Jar S.A. develops and publishes survival simulator games in Warsaw.
Exceptional growth potential with flawless balance sheet.
