Stock Analysis
- Netherlands
- /
- Chemicals
- /
- ENXTAM:CRBN
Corbion's (AMS:CRBN) earnings have declined over three years, contributing to shareholders 54% loss

Corbion N.V. (AMS:CRBN) shareholders should be happy to see the share price up 10% in the last month. But over the last three years we've seen a quite serious decline. Indeed, the share price is down a tragic 56% in the last three years. So the improvement may be a real relief to some. While many would remain nervous, there could be further gains if the business can put its best foot forward.
The recent uptick of 4.4% could be a positive sign of things to come, so let's take a look at historical fundamentals.
Check out our latest analysis for Corbion
There is no denying that markets are sometimes efficient, but prices do not always reflect underlying business performance. One flawed but reasonable way to assess how sentiment around a company has changed is to compare the earnings per share (EPS) with the share price.
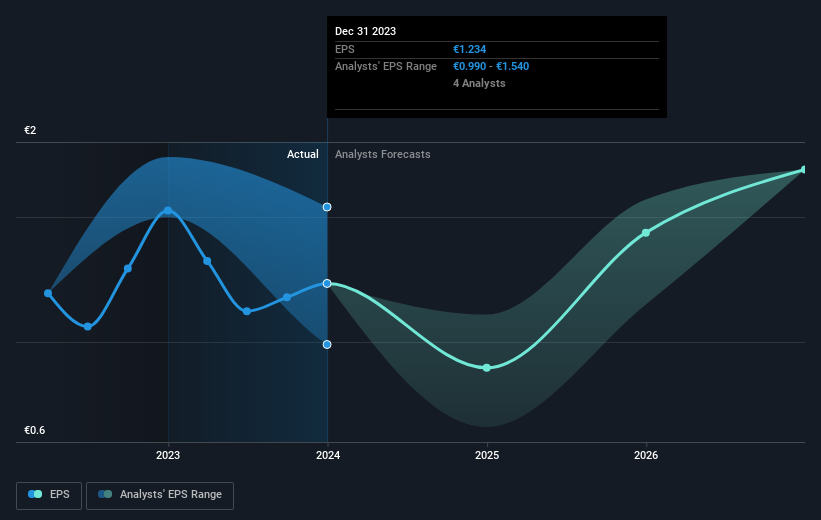
Corbion saw its EPS decline at a compound rate of 0.2% per year, over the last three years. The share price decline of 24% is actually steeper than the EPS slippage. So it's likely that the EPS decline has disappointed the market, leaving investors hesitant to buy.
The company's earnings per share (over time) is depicted in the image below (click to see the exact numbers).
We like that insiders have been buying shares in the last twelve months. Having said that, most people consider earnings and revenue growth trends to be a more meaningful guide to the business. Dive deeper into the earnings by checking this interactive graph of Corbion's earnings, revenue and cash flow.
What About Dividends?
When looking at investment returns, it is important to consider the difference between total shareholder return (TSR) and share price return. The TSR is a return calculation that accounts for the value of cash dividends (assuming that any dividend received was reinvested) and the calculated value of any discounted capital raisings and spin-offs. So for companies that pay a generous dividend, the TSR is often a lot higher than the share price return. In the case of Corbion, it has a TSR of -54% for the last 3 years. That exceeds its share price return that we previously mentioned. This is largely a result of its dividend payments!
A Different Perspective
Corbion shareholders are down 33% for the year (even including dividends), but the market itself is up 23%. However, keep in mind that even the best stocks will sometimes underperform the market over a twelve month period. Regrettably, last year's performance caps off a bad run, with the shareholders facing a total loss of 3% per year over five years. Generally speaking long term share price weakness can be a bad sign, though contrarian investors might want to research the stock in hope of a turnaround. It's always interesting to track share price performance over the longer term. But to understand Corbion better, we need to consider many other factors. Consider risks, for instance. Every company has them, and we've spotted 3 warning signs for Corbion you should know about.
Corbion is not the only stock that insiders are buying. For those who like to find winning investments this free list of growing companies with recent insider purchasing, could be just the ticket.
Please note, the market returns quoted in this article reflect the market weighted average returns of stocks that currently trade on Dutch exchanges.
Valuation is complex, but we're helping make it simple.
Find out whether Corbion is potentially over or undervalued by checking out our comprehensive analysis, which includes fair value estimates, risks and warnings, dividends, insider transactions and financial health.
View the Free AnalysisHave feedback on this article? Concerned about the content? Get in touch with us directly. Alternatively, email editorial-team (at) simplywallst.com.
This article by Simply Wall St is general in nature. We provide commentary based on historical data and analyst forecasts only using an unbiased methodology and our articles are not intended to be financial advice. It does not constitute a recommendation to buy or sell any stock, and does not take account of your objectives, or your financial situation. We aim to bring you long-term focused analysis driven by fundamental data. Note that our analysis may not factor in the latest price-sensitive company announcements or qualitative material. Simply Wall St has no position in any stocks mentioned.
About ENXTAM:CRBN
Corbion
Corbion N.V. provides lactic acid and lactic acid derivatives, other ferment, functional enzyme blends, minerals, vitamins, and algae ingredients worldwide.
Mediocre balance sheet second-rate dividend payer.
