Stock Analysis
- Taiwan
- /
- Metals and Mining
- /
- TWSE:2010
Chun Yuan Steel Industry (TWSE:2010) stock performs better than its underlying earnings growth over last five years
When you buy shares in a company, it's worth keeping in mind the possibility that it could fail, and you could lose your money. But on a lighter note, a good company can see its share price rise well over 100%. One great example is Chun Yuan Steel Industry Co., Ltd. (TWSE:2010) which saw its share price drive 108% higher over five years. In more good news, the share price has risen 25% in thirty days. We note that Chun Yuan Steel Industry reported its financial results recently; luckily, you can catch up on the latest revenue and profit numbers in our company report.
Since the stock has added NT$1.4b to its market cap in the past week alone, let's see if underlying performance has been driving long-term returns.
Check out our latest analysis for Chun Yuan Steel Industry
In his essay The Superinvestors of Graham-and-Doddsville Warren Buffett described how share prices do not always rationally reflect the value of a business. One way to examine how market sentiment has changed over time is to look at the interaction between a company's share price and its earnings per share (EPS).
During five years of share price growth, Chun Yuan Steel Industry achieved compound earnings per share (EPS) growth of 29% per year. The EPS growth is more impressive than the yearly share price gain of 16% over the same period. Therefore, it seems the market has become relatively pessimistic about the company.
You can see below how EPS has changed over time (discover the exact values by clicking on the image).
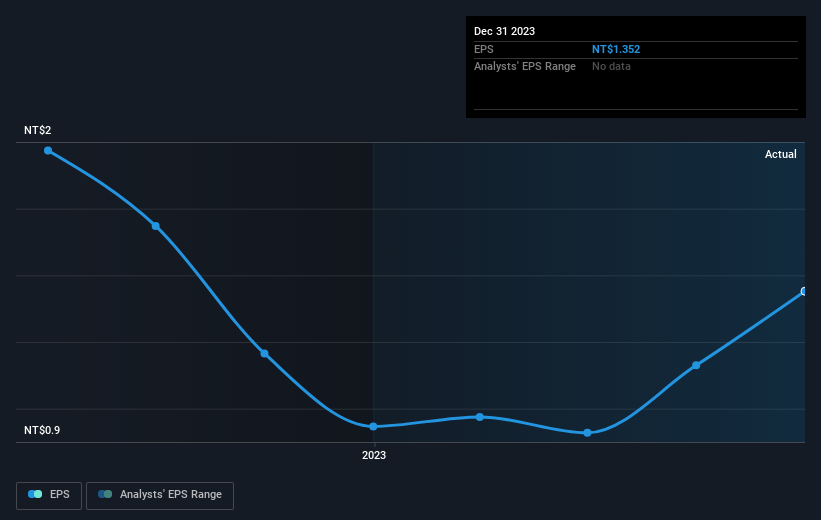
Before buying or selling a stock, we always recommend a close examination of historic growth trends, available here.
What About Dividends?
It is important to consider the total shareholder return, as well as the share price return, for any given stock. The TSR is a return calculation that accounts for the value of cash dividends (assuming that any dividend received was reinvested) and the calculated value of any discounted capital raisings and spin-offs. It's fair to say that the TSR gives a more complete picture for stocks that pay a dividend. We note that for Chun Yuan Steel Industry the TSR over the last 5 years was 151%, which is better than the share price return mentioned above. And there's no prize for guessing that the dividend payments largely explain the divergence!
A Different Perspective
It's nice to see that Chun Yuan Steel Industry shareholders have received a total shareholder return of 40% over the last year. Of course, that includes the dividend. That's better than the annualised return of 20% over half a decade, implying that the company is doing better recently. Someone with an optimistic perspective could view the recent improvement in TSR as indicating that the business itself is getting better with time. I find it very interesting to look at share price over the long term as a proxy for business performance. But to truly gain insight, we need to consider other information, too. Consider for instance, the ever-present spectre of investment risk. We've identified 1 warning sign with Chun Yuan Steel Industry , and understanding them should be part of your investment process.
We will like Chun Yuan Steel Industry better if we see some big insider buys. While we wait, check out this free list of growing companies with considerable, recent, insider buying.
Please note, the market returns quoted in this article reflect the market weighted average returns of stocks that currently trade on Taiwanese exchanges.
Valuation is complex, but we're helping make it simple.
Find out whether Chun Yuan Steel Industry is potentially over or undervalued by checking out our comprehensive analysis, which includes fair value estimates, risks and warnings, dividends, insider transactions and financial health.
View the Free AnalysisHave feedback on this article? Concerned about the content? Get in touch with us directly. Alternatively, email editorial-team (at) simplywallst.com.
This article by Simply Wall St is general in nature. We provide commentary based on historical data and analyst forecasts only using an unbiased methodology and our articles are not intended to be financial advice. It does not constitute a recommendation to buy or sell any stock, and does not take account of your objectives, or your financial situation. We aim to bring you long-term focused analysis driven by fundamental data. Note that our analysis may not factor in the latest price-sensitive company announcements or qualitative material. Simply Wall St has no position in any stocks mentioned.

Simply Wall St
About TWSE:2010
Chun Yuan Steel Industry
Chun Yuan Steel Industry Co., Ltd. produces and sells steel products in Taiwan and rest of Asia.
Solid track record with excellent balance sheet and pays a dividend.
