Stock Analysis
- Singapore
- /
- Energy Services
- /
- SGX:49B
AMOS Group Limited's (SGX:49B) Price Is Right But Growth Is Lacking After Shares Rocket 32%
Those holding AMOS Group Limited (SGX:49B) shares would be relieved that the share price has rebounded 32% in the last thirty days, but it needs to keep going to repair the recent damage it has caused to investor portfolios. But the last month did very little to improve the 61% share price decline over the last year.
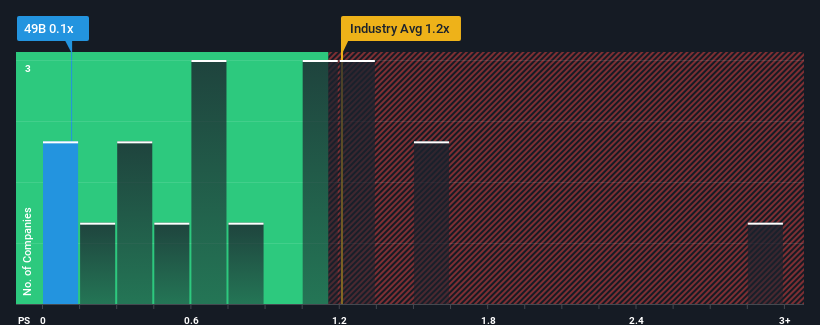
Although its price has surged higher, given about half the companies operating in Singapore's Energy Services industry have price-to-sales ratios (or "P/S") above 0.9x, you may still consider AMOS Group as an attractive investment with its 0.1x P/S ratio. Nonetheless, we'd need to dig a little deeper to determine if there is a rational basis for the reduced P/S.
View our latest analysis for AMOS Group
How Has AMOS Group Performed Recently?
As an illustration, revenue has deteriorated at AMOS Group over the last year, which is not ideal at all. One possibility is that the P/S is low because investors think the company won't do enough to avoid underperforming the broader industry in the near future. Those who are bullish on AMOS Group will be hoping that this isn't the case so that they can pick up the stock at a lower valuation.
We don't have analyst forecasts, but you can see how recent trends are setting up the company for the future by checking out our free report on AMOS Group's earnings, revenue and cash flow.How Is AMOS Group's Revenue Growth Trending?
AMOS Group's P/S ratio would be typical for a company that's only expected to deliver limited growth, and importantly, perform worse than the industry.
Taking a look back first, the company's revenue growth last year wasn't something to get excited about as it posted a disappointing decline of 6.9%. As a result, revenue from three years ago have also fallen 23% overall. So unfortunately, we have to acknowledge that the company has not done a great job of growing revenue over that time.
Weighing that medium-term revenue trajectory against the broader industry's one-year forecast for expansion of 16% shows it's an unpleasant look.
With this in mind, we understand why AMOS Group's P/S is lower than most of its industry peers. Nonetheless, there's no guarantee the P/S has reached a floor yet with revenue going in reverse. There's potential for the P/S to fall to even lower levels if the company doesn't improve its top-line growth.
The Final Word
AMOS Group's stock price has surged recently, but its but its P/S still remains modest. Generally, our preference is to limit the use of the price-to-sales ratio to establishing what the market thinks about the overall health of a company.
As we suspected, our examination of AMOS Group revealed its shrinking revenue over the medium-term is contributing to its low P/S, given the industry is set to grow. At this stage investors feel the potential for an improvement in revenue isn't great enough to justify a higher P/S ratio. Given the current circumstances, it seems unlikely that the share price will experience any significant movement in either direction in the near future if recent medium-term revenue trends persist.
Before you take the next step, you should know about the 2 warning signs for AMOS Group that we have uncovered.
Of course, profitable companies with a history of great earnings growth are generally safer bets. So you may wish to see this free collection of other companies that have reasonable P/E ratios and have grown earnings strongly.
Valuation is complex, but we're helping make it simple.
Find out whether AMOS Group is potentially over or undervalued by checking out our comprehensive analysis, which includes fair value estimates, risks and warnings, dividends, insider transactions and financial health.
View the Free AnalysisHave feedback on this article? Concerned about the content? Get in touch with us directly. Alternatively, email editorial-team (at) simplywallst.com.
This article by Simply Wall St is general in nature. We provide commentary based on historical data and analyst forecasts only using an unbiased methodology and our articles are not intended to be financial advice. It does not constitute a recommendation to buy or sell any stock, and does not take account of your objectives, or your financial situation. We aim to bring you long-term focused analysis driven by fundamental data. Note that our analysis may not factor in the latest price-sensitive company announcements or qualitative material. Simply Wall St has no position in any stocks mentioned.

Simply Wall St
About SGX:49B
AMOS Group
AMOS Group Limited, an investment holding company, manufactures and supplies rigging and lifting equipment for offshore oil and gas, and marine industries worldwide.
Flawless balance sheet and good value.
