Stock Analysis


Key Insights
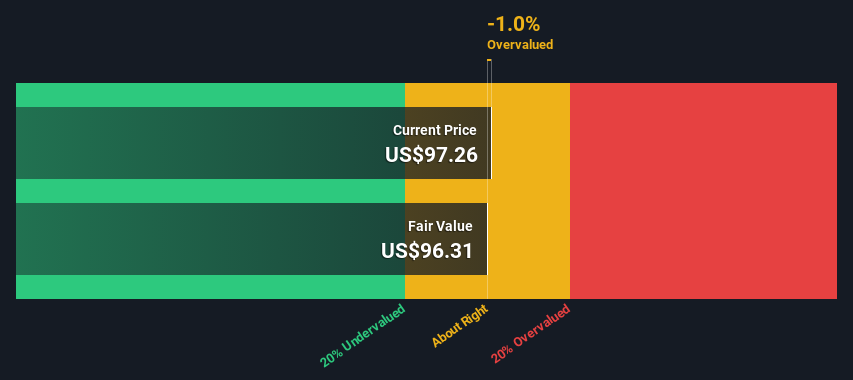
- Using the 2 Stage Free Cash Flow to Equity, ESCO Technologies fair value estimate is US$96.31
- Current share price of US$97.26 suggests ESCO Technologies is potentially trading close to its fair value
- Analyst price target for ESE is US$121, which is 26% above our fair value estimate
In this article we are going to estimate the intrinsic value of ESCO Technologies Inc. (NYSE:ESE) by taking the expected future cash flows and discounting them to their present value. Our analysis will employ the Discounted Cash Flow (DCF) model. There's really not all that much to it, even though it might appear quite complex.
We generally believe that a company's value is the present value of all of the cash it will generate in the future. However, a DCF is just one valuation metric among many, and it is not without flaws. If you still have some burning questions about this type of valuation, take a look at the Simply Wall St analysis model.
Check out our latest analysis for ESCO Technologies
Crunching The Numbers
We're using the 2-stage growth model, which simply means we take in account two stages of company's growth. In the initial period the company may have a higher growth rate and the second stage is usually assumed to have a stable growth rate. To begin with, we have to get estimates of the next ten years of cash flows. Where possible we use analyst estimates, but when these aren't available we extrapolate the previous free cash flow (FCF) from the last estimate or reported value. We assume companies with shrinking free cash flow will slow their rate of shrinkage, and that companies with growing free cash flow will see their growth rate slow, over this period. We do this to reflect that growth tends to slow more in the early years than it does in later years.
A DCF is all about the idea that a dollar in the future is less valuable than a dollar today, so we discount the value of these future cash flows to their estimated value in today's dollars:
10-year free cash flow (FCF) forecast
| 2024 | 2025 | 2026 | 2027 | 2028 | 2029 | 2030 | 2031 | 2032 | 2033 | |
| Levered FCF ($, Millions) | US$100.7m | US$111.3m | US$119.2m | US$125.9m | US$131.8m | US$137.0m | US$141.7m | US$146.1m | US$150.2m | US$154.3m |
| Growth Rate Estimate Source | Analyst x2 | Analyst x2 | Est @ 7.11% | Est @ 5.66% | Est @ 4.65% | Est @ 3.94% | Est @ 3.45% | Est @ 3.10% | Est @ 2.86% | Est @ 2.69% |
| Present Value ($, Millions) Discounted @ 7.2% | US$93.9 | US$96.8 | US$96.7 | US$95.3 | US$93.0 | US$90.1 | US$86.9 | US$83.6 | US$80.2 | US$76.8 |
("Est" = FCF growth rate estimated by Simply Wall St)
Present Value of 10-year Cash Flow (PVCF) = US$893m
The second stage is also known as Terminal Value, this is the business's cash flow after the first stage. The Gordon Growth formula is used to calculate Terminal Value at a future annual growth rate equal to the 5-year average of the 10-year government bond yield of 2.3%. We discount the terminal cash flows to today's value at a cost of equity of 7.2%.
Terminal Value (TV)= FCF2033 × (1 + g) ÷ (r – g) = US$154m× (1 + 2.3%) ÷ (7.2%– 2.3%) = US$3.2b
Present Value of Terminal Value (PVTV)= TV / (1 + r)10= US$3.2b÷ ( 1 + 7.2%)10= US$1.6b
The total value is the sum of cash flows for the next ten years plus the discounted terminal value, which results in the Total Equity Value, which in this case is US$2.5b. The last step is to then divide the equity value by the number of shares outstanding. Compared to the current share price of US$97.3, the company appears around fair value at the time of writing. Valuations are imprecise instruments though, rather like a telescope - move a few degrees and end up in a different galaxy. Do keep this in mind.
The Assumptions
Now the most important inputs to a discounted cash flow are the discount rate, and of course, the actual cash flows. If you don't agree with these result, have a go at the calculation yourself and play with the assumptions. The DCF also does not consider the possible cyclicality of an industry, or a company's future capital requirements, so it does not give a full picture of a company's potential performance. Given that we are looking at ESCO Technologies as potential shareholders, the cost of equity is used as the discount rate, rather than the cost of capital (or weighted average cost of capital, WACC) which accounts for debt. In this calculation we've used 7.2%, which is based on a levered beta of 1.073. Beta is a measure of a stock's volatility, compared to the market as a whole. We get our beta from the industry average beta of globally comparable companies, with an imposed limit between 0.8 and 2.0, which is a reasonable range for a stable business.
SWOT Analysis for ESCO Technologies
- Earnings growth over the past year exceeded its 5-year average.
- Debt is not viewed as a risk.
- Earnings growth over the past year underperformed the Machinery industry.
- Dividend is low compared to the top 25% of dividend payers in the Machinery market.
- Expensive based on P/E ratio and estimated fair value.
- Annual earnings are forecast to grow faster than the American market.
- Annual revenue is forecast to grow slower than the American market.
Next Steps:
Whilst important, the DCF calculation shouldn't be the only metric you look at when researching a company. It's not possible to obtain a foolproof valuation with a DCF model. Rather it should be seen as a guide to "what assumptions need to be true for this stock to be under/overvalued?" For instance, if the terminal value growth rate is adjusted slightly, it can dramatically alter the overall result. For ESCO Technologies, we've compiled three relevant items you should look at:
- Financial Health: Does ESE have a healthy balance sheet? Take a look at our free balance sheet analysis with six simple checks on key factors like leverage and risk.
- Future Earnings: How does ESE's growth rate compare to its peers and the wider market? Dig deeper into the analyst consensus number for the upcoming years by interacting with our free analyst growth expectation chart.
- Other High Quality Alternatives: Do you like a good all-rounder? Explore our interactive list of high quality stocks to get an idea of what else is out there you may be missing!
PS. The Simply Wall St app conducts a discounted cash flow valuation for every stock on the NYSE every day. If you want to find the calculation for other stocks just search here.
Valuation is complex, but we're helping make it simple.
Find out whether ESCO Technologies is potentially over or undervalued by checking out our comprehensive analysis, which includes fair value estimates, risks and warnings, dividends, insider transactions and financial health.
View the Free AnalysisHave feedback on this article? Concerned about the content? Get in touch with us directly. Alternatively, email editorial-team (at) simplywallst.com.
This article by Simply Wall St is general in nature. We provide commentary based on historical data and analyst forecasts only using an unbiased methodology and our articles are not intended to be financial advice. It does not constitute a recommendation to buy or sell any stock, and does not take account of your objectives, or your financial situation. We aim to bring you long-term focused analysis driven by fundamental data. Note that our analysis may not factor in the latest price-sensitive company announcements or qualitative material. Simply Wall St has no position in any stocks mentioned.
About NYSE:ESE
ESCO Technologies
ESCO Technologies Inc. produces and supplies engineered products and systems for industrial and commercial markets worldwide.
Flawless balance sheet with acceptable track record.
