
Advertisement
- United States
- /
- Semiconductors
- /
- NasdaqCM:NVEC
Are NVE Corporation's (NASDAQ:NVEC) Mixed Financials The Reason For Its Gloomy Performance on The Stock Market?

NVE (NASDAQ:NVEC) has had a rough three months with its share price down 19%. It seems that the market might have completely ignored the positive aspects of the company's fundamentals and decided to weigh-in more on the negative aspects. Stock prices are usually driven by a company’s financial performance over the long term, and therefore we decided to pay more attention to the company's financial performance. Particularly, we will be paying attention to NVE's ROE today.
Return on Equity or ROE is a test of how effectively a company is growing its value and managing investors’ money. In simpler terms, it measures the profitability of a company in relation to shareholder's equity.
Check out our latest analysis for NVE
How To Calculate Return On Equity?
ROE can be calculated by using the formula:
Return on Equity = Net Profit (from continuing operations) ÷ Shareholders' Equity
So, based on the above formula, the ROE for NVE is:
19% = US$15m ÷ US$78m (Based on the trailing twelve months to March 2020).
The 'return' is the income the business earned over the last year. One way to conceptualize this is that for each $1 of shareholders' capital it has, the company made $0.19 in profit.
What Has ROE Got To Do With Earnings Growth?
We have already established that ROE serves as an efficient profit-generating gauge for a company's future earnings. We now need to evaluate how much profit the company reinvests or "retains" for future growth which then gives us an idea about the growth potential of the company. Assuming all else is equal, companies that have both a higher return on equity and higher profit retention are usually the ones that have a higher growth rate when compared to companies that don't have the same features.
A Side By Side comparison of NVE's Earnings Growth And 19% ROE
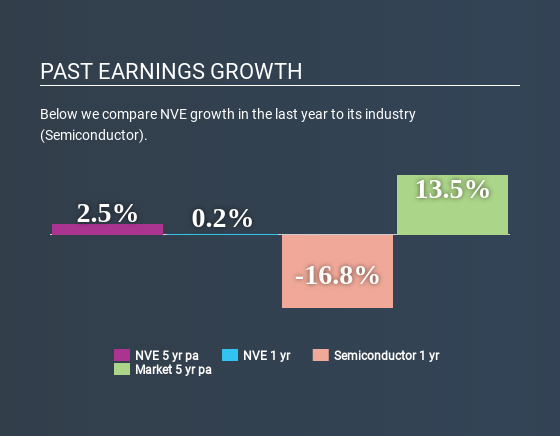
To begin with, NVE seems to have a respectable ROE. Further, the company's ROE compares quite favorably to the industry average of 10%. Despite this, NVE's five year net income growth was quite low averaging at only 2.5%. This is interesting as the high returns should mean that the company has the ability to generate high growth but for some reason, it hasn't been able to do so. A few likely reasons why this could happen is that the company could have a high payout ratio or the business has allocated capital poorly, for instance.
As a next step, we compared NVE's net income growth with the industry and were disappointed to see that the company's growth is lower than the industry average growth of 21% in the same period.
Earnings growth is an important metric to consider when valuing a stock. It’s important for an investor to know whether the market has priced in the company's expected earnings growth (or decline). This then helps them determine if the stock is placed for a bright or bleak future. One good indicator of expected earnings growth is the P/E ratio which determines the price the market is willing to pay for a stock based on its earnings prospects. So, you may want to check if NVE is trading on a high P/E or a low P/E, relative to its industry.
Is NVE Making Efficient Use Of Its Profits?
NVE has a very high three-year median payout ratio of 141%, which suggests that the company is dipping into more than just its profits to pay its dividend and that shows in its low earnings growth number. This is indicative of risk. Our risks dashboard should have the 2 risks we have identified for NVE.
Additionally, NVE has paid dividends over a period of five years, which means that the company's management is determined to pay dividends even if it means little to no earnings growth.
Summary
In total, we're a bit ambivalent about NVE's performance. While the company does have a high rate of return, its low earnings retention is probably what's hampering its earnings growth. Until now, we have only just grazed the surface of the company's past performance by looking at the company's fundamentals. To gain further insights into NVE's past profit growth, check out this visualization of past earnings, revenue and cash flows.
Love or hate this article? Concerned about the content? Get in touch with us directly. Alternatively, email editorial-team@simplywallst.com.
This article by Simply Wall St is general in nature. It does not constitute a recommendation to buy or sell any stock, and does not take account of your objectives, or your financial situation. We aim to bring you long-term focused analysis driven by fundamental data. Note that our analysis may not factor in the latest price-sensitive company announcements or qualitative material. Simply Wall St has no position in any stocks mentioned. Thank you for reading.
About NasdaqCM:NVEC
NVE
Develops and sells devices that use spintronics, a nanotechnology relying on electron spin to acquire, store, and transmit information, both in the United States and internationally.
Flawless balance sheet with proven track record.
Similar Companies
Market Insights

Advertisement
Community Narratives
The Future of Drug Testing? Fingerprint Tech Shows Serious Promise
Fair Value US$2.98|36.2% undervalued
JO
Community Contributor
Occidental Petroleum is set to achieve a 16% profit margin improvement
Fair Value US$55.05|18.7% undervalued
DZ
Community Contributor
Argan's Revenue Set to Soar with a 13.31% Growth in the Coming Decade
Fair Value US$284.68|22.0% undervalued
KE
Community Contributor
EU#1 - From German Startup to EU’s Biggest Company
Fair Value €248.62|5.0% overvalued
TO
Community Contributor