
Advertisement
- Canada
- /
- Oil and Gas
- /
- TSX:CVE
Are Cenovus Energy Inc.’s (TSE:CVE) Returns On Investment Worth Your While?

Today we are going to look at Cenovus Energy Inc. (TSE:CVE) to see whether it might be an attractive investment prospect. To be precise, we'll consider its Return On Capital Employed (ROCE), as that will inform our view of the quality of the business.
Firstly, we'll go over how we calculate ROCE. Second, we'll look at its ROCE compared to similar companies. And finally, we'll look at how its current liabilities are impacting its ROCE.
What is Return On Capital Employed (ROCE)?
ROCE is a measure of a company's yearly pre-tax profit (its return), relative to the capital employed in the business. In general, businesses with a higher ROCE are usually better quality. In brief, it is a useful tool, but it is not without drawbacks. Renowned investment researcher Michael Mauboussin has suggested that a high ROCE can indicate that 'one dollar invested in the company generates value of more than one dollar'.
So, How Do We Calculate ROCE?
The formula for calculating the return on capital employed is:
Return on Capital Employed = Earnings Before Interest and Tax (EBIT) ÷ (Total Assets - Current Liabilities)
Or for Cenovus Energy:
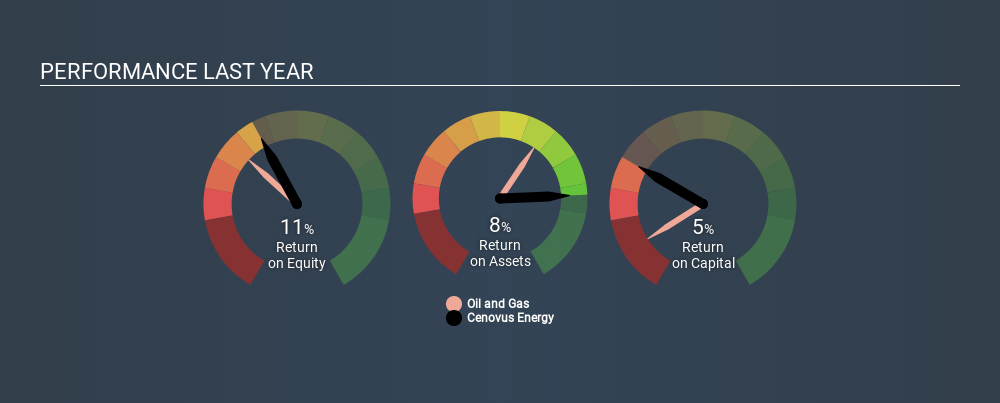
0.048 = CA$1.6b ÷ (CA$36b - CA$2.5b) (Based on the trailing twelve months to December 2019.)
Therefore, Cenovus Energy has an ROCE of 4.8%.
Check out our latest analysis for Cenovus Energy
Is Cenovus Energy's ROCE Good?
ROCE is commonly used for comparing the performance of similar businesses. Using our data, Cenovus Energy's ROCE appears to be around the 5.4% average of the Oil and Gas industry. Aside from the industry comparison, Cenovus Energy's ROCE is mediocre in absolute terms, considering the risk of investing in stocks versus the safety of a bank account. It is possible that there are more rewarding investments out there.
Cenovus Energy reported an ROCE of 4.8% -- better than 3 years ago, when the company didn't make a profit. This makes us wonder if the company is improving. You can click on the image below to see (in greater detail) how Cenovus Energy's past growth compares to other companies.
It is important to remember that ROCE shows past performance, and is not necessarily predictive. ROCE can be deceptive for cyclical businesses, as returns can look incredible in boom times, and terribly low in downturns. ROCE is only a point-in-time measure. Given the industry it operates in, Cenovus Energy could be considered cyclical. What happens in the future is pretty important for investors, so we have prepared a free report on analyst forecasts for Cenovus Energy.
What Are Current Liabilities, And How Do They Affect Cenovus Energy's ROCE?
Short term (or current) liabilities, are things like supplier invoices, overdrafts, or tax bills that need to be paid within 12 months. Due to the way the ROCE equation works, having large bills due in the near term can make it look as though a company has less capital employed, and thus a higher ROCE than usual. To counteract this, we check if a company has high current liabilities, relative to its total assets.
Cenovus Energy has total assets of CA$36b and current liabilities of CA$2.5b. Therefore its current liabilities are equivalent to approximately 7.1% of its total assets. Cenovus Energy has a low level of current liabilities, which have a minimal impact on its uninspiring ROCE.
The Bottom Line On Cenovus Energy's ROCE
If performance improves, then Cenovus Energy may be an OK investment, especially at the right valuation. But note: make sure you look for a great company, not just the first idea you come across. So take a peek at this free list of interesting companies with strong recent earnings growth (and a P/E ratio below 20).
There are plenty of other companies that have insiders buying up shares. You probably do not want to miss this free list of growing companies that insiders are buying.
If you spot an error that warrants correction, please contact the editor at editorial-team@simplywallst.com. This article by Simply Wall St is general in nature. It does not constitute a recommendation to buy or sell any stock, and does not take account of your objectives, or your financial situation. Simply Wall St has no position in the stocks mentioned.
We aim to bring you long-term focused research analysis driven by fundamental data. Note that our analysis may not factor in the latest price-sensitive company announcements or qualitative material. Thank you for reading.
About TSX:CVE
Cenovus Energy
Develops, produces, refines, transports, and markets crude oil, natural gas, and refined petroleum products in Canada, the United States, and China.
Very undervalued with excellent balance sheet.
Similar Companies
Market Insights

Advertisement
Community Narratives
Vita Life Sciences Set for a 12.72% Revenue Growth While Tackling Operational Challenges
Fair Value AU$2.42|9.1% undervalued
RO
Community Contributor
Vossloh rides a €500 billion wave to boost growth and earnings in the next decade
Fair Value €78.41|5.2% undervalued
CH
Community Contributor
Intuitive Surgical Will Transform Healthcare with 12% Revenue Growth
Fair Value US$325.55|57.3% overvalued
UN
Community Contributor