
Advertisement
- India
- /
- Professional Services
- /
- NSEI:AIRAN
Airan Limited’s (NSE:AIRAN) Investment Returns Are Lagging Its Industry

Today we are going to look at Airan Limited (NSE:AIRAN) to see whether it might be an attractive investment prospect. Specifically, we're going to calculate its Return On Capital Employed (ROCE), in the hopes of getting some insight into the business.
First, we'll go over how we calculate ROCE. Then we'll compare its ROCE to similar companies. Finally, we'll look at how its current liabilities affect its ROCE.
Return On Capital Employed (ROCE): What is it?
ROCE measures the 'return' (pre-tax profit) a company generates from capital employed in its business. Generally speaking a higher ROCE is better. Overall, it is a valuable metric that has its flaws. Author Edwin Whiting says to be careful when comparing the ROCE of different businesses, since 'No two businesses are exactly alike.
So, How Do We Calculate ROCE?
Analysts use this formula to calculate return on capital employed:
Return on Capital Employed = Earnings Before Interest and Tax (EBIT) ÷ (Total Assets - Current Liabilities)
Or for Airan:
0.11 = ₹98m ÷ (₹1.0b - ₹109m) (Based on the trailing twelve months to September 2019.)
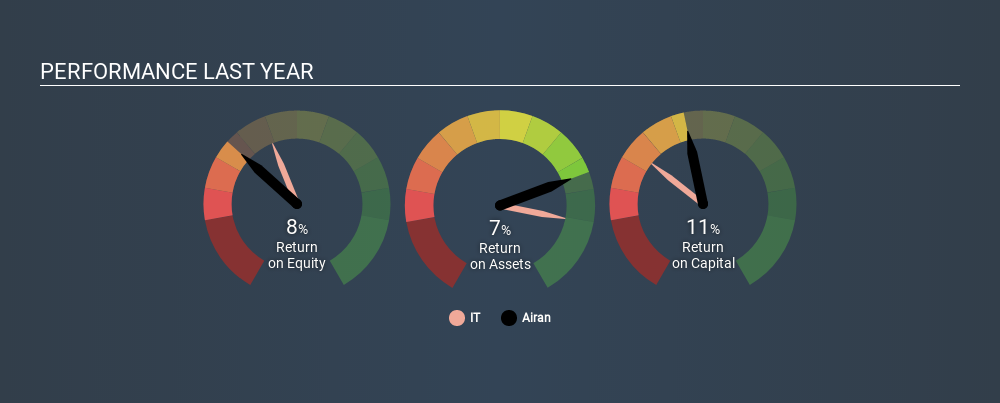
So, Airan has an ROCE of 11%.
Check out our latest analysis for Airan
Is Airan's ROCE Good?
One way to assess ROCE is to compare similar companies. We can see Airan's ROCE is meaningfully below the IT industry average of 14%. This could be seen as a negative, as it suggests some competitors may be employing their capital more efficiently. Aside from the industry comparison, Airan's ROCE is mediocre in absolute terms, considering the risk of investing in stocks versus the safety of a bank account. Investors may wish to consider higher-performing investments.
In our analysis, Airan's ROCE appears to be 11%, compared to 3 years ago, when its ROCE was 5.8%. This makes us think the business might be improving. You can see in the image below how Airan's ROCE compares to its industry. Click to see more on past growth.
It is important to remember that ROCE shows past performance, and is not necessarily predictive. ROCE can be misleading for companies in cyclical industries, with returns looking impressive during the boom times, but very weak during the busts. ROCE is only a point-in-time measure. You can check if Airan has cyclical profits by looking at this free graph of past earnings, revenue and cash flow.
Do Airan's Current Liabilities Skew Its ROCE?
Current liabilities include invoices, such as supplier payments, short-term debt, or a tax bill, that need to be paid within 12 months. Due to the way the ROCE equation works, having large bills due in the near term can make it look as though a company has less capital employed, and thus a higher ROCE than usual. To check the impact of this, we calculate if a company has high current liabilities relative to its total assets.
Airan has total liabilities of ₹109m and total assets of ₹1.0b. Therefore its current liabilities are equivalent to approximately 11% of its total assets. This is a modest level of current liabilities, which would only have a small effect on ROCE.
Our Take On Airan's ROCE
With that in mind, we're not overly impressed with Airan's ROCE, so it may not be the most appealing prospect. You might be able to find a better investment than Airan. If you want a selection of possible winners, check out this free list of interesting companies that trade on a P/E below 20 (but have proven they can grow earnings).
For those who like to find winning investments this free list of growing companies with recent insider purchasing, could be just the ticket.
If you spot an error that warrants correction, please contact the editor at editorial-team@simplywallst.com. This article by Simply Wall St is general in nature. It does not constitute a recommendation to buy or sell any stock, and does not take account of your objectives, or your financial situation. Simply Wall St has no position in the stocks mentioned.
We aim to bring you long-term focused research analysis driven by fundamental data. Note that our analysis may not factor in the latest price-sensitive company announcements or qualitative material. Thank you for reading.
About NSEI:AIRAN
Airan
Provides information technology (IT) and IT-enabled services in India.
Flawless balance sheet with solid track record.
Similar Companies
Market Insights

Advertisement
Community Narratives
Vita Life Sciences Set for a 12.72% Revenue Growth While Tackling Operational Challenges
Fair Value AU$2.42|12.0% undervalued
RO
Community Contributor
Vossloh rides a €500 billion wave to boost growth and earnings in the next decade
Fair Value €78.41|4.0% undervalued
CH
Community Contributor
Intuitive Surgical Will Transform Healthcare with 12% Revenue Growth
Fair Value US$325.55|59.4% overvalued
UN
Community Contributor