

Last Update 06 Jul 26
Fair value Increased 11%SAIC: Contract Recompete Risks Will Test Q1 Margin Strength
Analysts have lifted the fair value estimate for Science Applications International to $96.13 from $86.80, reflecting updated views on its Q1 earnings beat, slightly lower discount rate assumptions, improved profit margin expectations, and revised P/E and revenue trajectories across a series of recent price target increases.
Analyst Commentary
Recent Street research on Science Applications International points to a mixed setup, with multiple firms lifting price targets after the Q1 earnings report while still flagging execution and growth risks that could limit upside. For readers, the key is less the absolute target level and more the reasoning behind cautious stances that sit alongside more constructive views.
Several firms describe Q1 as a strong or better than expected quarter and reference guidance that some see as achievable, yet not all are prepared to shift to a more positive rating. Neutral and Hold ratings remain common, even where targets have moved higher, which suggests that some analysts view the recent results as already reflected in the stock or balanced by potential headwinds.
There is also a range of opinion on Science Applications International's revenue trajectory and margin profile. Some analysts point to an upward bias to revenue estimates or guidance that could be conservative, while others explicitly flag the risk that certain Q1 margin levels may not be sustainable, especially in specific segments. This gap in views is an important signal for investors who are weighing how much of the Q1 performance can reasonably be extrapolated.
Another theme is the focus on contract risk and timing. Analysts referencing the Evolve recompete in the second half of fiscal 2027 and the delayed roll off of the RITS contract highlight concentration around key programs. These factors are being watched closely, as they can influence both top line visibility and margin trends, and they are part of the reason why some firms keep more cautious ratings despite higher price targets.
Even where targets are set above the current fair value estimate, several firms retain Neutral style ratings, including large banks such as JPMorgan. This mix of higher targets with neutral stances underscores that, while Q1 has been received as a positive data point, there is still debate about how much further upside is justified relative to execution, growth and contract renewal risks.
Bearish Takeaways
- Bearish analysts acknowledge the Q1 earnings beat but argue that parts of the Civil segment margin performance may not be sustainable, which could limit how much of the quarter's profitability should be capitalized into longer term valuation.
- Concerns around key contract events, including the Evolve recompete in the second half of fiscal 2027 and the delayed roll off of the RITS contract, are cited as potential pressure points for Science Applications International's growth and earnings visibility.
- Some bearish analysts maintain Hold or Neutral ratings even after raising price targets, signaling that, in their view, the stock already reflects much of the Q1 strength and should trade closer to group averages on metrics such as organic growth, margins, leverage and recompete performance.
- Large firms such as Goldman Sachs and JPMorgan, while lifting targets following Q1, still refrain from a more positive stance, which reinforces the idea that valuation upside is seen by some as constrained by execution risks and the need to prove that recent performance is repeatable.
What’s in the News for Science Applications International
- Science Applications International Corp. received a follow on US$50.6 million task order from the U.S. Navy’s Naval Undersea Warfare Center in Newport, Rhode Island, to continue work on torpedo defense system design, modernization, and sustainment services, leveraging digital engineering and advanced modeling and simulation capabilities. (Client Announcements)
- The company reported that from February 1, 2026 to May 1, 2026, it repurchased 1,875,172 shares for US$174.57 million, representing 4.26% of shares. This brought total repurchases under the buyback announced on December 5, 2024 to 6,569,338 shares, or 14.27%, for US$677.98 million. (Buyback Tranche Update)
- Science Applications International Corp. was awarded a new US$75.2 million task order under the General Services Administration Personnel and Readiness Infrastructure Support Management contract to support the Naval Air Systems Command with engineering and sustainment services for Aircraft Armament Equipment and Support Equipment, as well as the MQ-25 Stingray aerial refueling system. (Client Announcements)
- The company highlighted its role as a mission assurance partner for the successful Artemis II mission. It provided safety analysis, risk mitigation, integrated hazard analysis, and real time mission expertise for systems including the Space Launch System, Orion spacecraft, and crew survival over the mission. (Client Announcements)
Valuation Changes
- Fair Value: The fair value estimate for Science Applications International has risen from $86.80 to $96.13, reflecting updated assumptions across key inputs.
- Discount Rate: The discount rate has edged lower from 8.50% to 8.45%, a small change that increases the present value of projected cash flows.
- Revenue Growth: The long term revenue growth assumption now reflects a smaller decline, moving from a 2.02% decline to a 1.30% decline, which slightly reduces the expected headwind to the top line.
- Net Profit Margin: The net profit margin assumption has moved higher from 4.78% to 5.50%, indicating an expectation for somewhat stronger profitability in future years.
- Future P/E: The future P/E multiple used in the model has shifted from 12.7x to 10.8x, a lower terminal valuation multiple that partially offsets the impact of higher fair value drivers.
Key Takeaways
- Dynamic government procurement and contract changes could risk revenue growth, compress margins, and increase exposure.
- Loss of key NASA program and shifting government priorities may pressure future revenue and earnings.
- Strategic focus on IT capabilities and fixed-price contracts positions SAIC for potential growth, revenue increase, and improved margins in defense sectors.
Catalysts
About Science Applications International- Provides technical, engineering, and enterprise information technology (IT) services in the United States.
- The company's revenue growth may be at risk due to a dynamic government procurement environment, with the administration focusing on technology efficiency initiatives that could introduce further operational challenges and uncertainties.
- There is potential for margin compression if the transition from cost-plus to fixed-price contracts happens too quickly, without adequate controls, potentially leading to increased risk exposure.
- Book-to-bill ratios remain under target, and recompete headwinds, including the loss of a substantial NASA program, may continue to pressure revenue and earnings growth, creating uncertainties in achieving projected performance metrics.
- Tight budget conditions and a potential shift in government spending priorities towards defense could limit growth opportunities in the civil sector, potentially impacting overall revenue expansion projections.
- Despite strong past performance, there is cautious optimism that historical growth rates may not be sustained, with substantial headwinds in on-contract growth expected to challenge maintaining high growth thresholds.
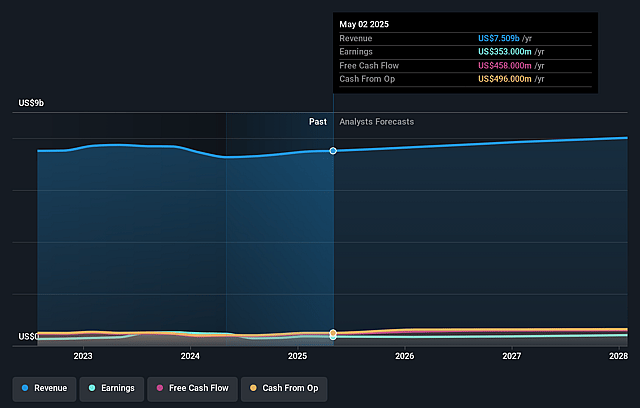
Science Applications International Future Earnings and Revenue Growth
Assumptions
How have these above catalysts been quantified?
- This narrative explores a more pessimistic perspective on Science Applications International compared to the consensus, based on a Fair Value that aligns with the bearish cohort of analysts.
- The bearish analysts are assuming Science Applications International's revenue will decrease by 1.3% annually over the next 3 years.
- The bearish analysts assume that profit margins will shrink from 5.6% today to 5.5% in 3 years time.
- The bearish analysts expect earnings to reach $385.3 million (and earnings per share of $10.35) by about July 2029, down from $405.0 million today. However, there is some disagreement amongst the analysts with the more bullish ones expecting earnings as high as $480.4 million.
- In order for the above numbers to justify the price target of the more bearish analyst cohort, the company would need to trade at a PE ratio of 10.8x on those 2029 earnings, down from 11.6x today. This future PE is lower than the current PE for the US Professional Services industry at 20.7x.
- The bearish analysts expect the number of shares outstanding to decline by 7.0% per year for the next 3 years.
- To value all of this in today's terms, we will use a discount rate of 8.45%, as per the Simply Wall St company report.
Risks
What could happen that would invalidate this narrative?- SAIC's continued investment in cutting-edge technology and mission-critical solutions positions it to potentially increase future revenues and improve on-contract growth, which could uplift earnings.
- The company's strategic focus on enterprise and mission IT capabilities, coupled with an increase in new bids and higher win rates, suggests potential growth in the defense and intelligence sectors, driving both revenue and margins higher.
- SAIC's transition from cost-plus to fixed-price contracts, where effective, is anticipated to lead to margin improvements, providing a boost to overall net margins.
- The robust backlog of submitted bids and the securing of major contracts such as the SSLE system software life cycle engineering contract provide visibility into future revenue streams and earnings stability.
- The expected increase in commercial sector revenue from $45 million to a target of $100 million by fiscal year 2028, with consistent healthy margins, reflects potential upward pressure on overall company earnings.
Valuation
How have all the factors above been brought together to estimate a fair value?
- The assumed bearish price target for Science Applications International is $96.13, which represents up to two standard deviations below the consensus price target of $120.8. This valuation is based on what can be assumed as the expectations of Science Applications International's future earnings growth, profit margins and other risk factors from analysts on the more bearish end of the spectrum.
- However, there is a degree of disagreement amongst analysts, with the most bullish reporting a price target of $137.0, and the most bearish reporting a price target of just $96.0.
- In order for you to agree with the more bearish analyst cohort, you'd need to believe that by 2029, revenues will be $7.0 billion, earnings will come to $385.3 million, and it would be trading on a PE ratio of 10.8x, assuming you use a discount rate of 8.4%.
- Given the current share price of $110.96, the analyst price target of $96.13 is 15.4% lower.
- We always encourage you to reach your own conclusions though. So sense check these analyst numbers against your own assumptions and expectations based on your understanding of the business and what you believe is probable.
Have other thoughts on Science Applications International?
Create your own narrative on this stock, and estimate its Fair Value using our Valuator tool.
Create NarrativeHow well do narratives help inform your perspective?
Disclaimer
AnalystLowTarget is a tool utilizing a Large Language Model (LLM) that ingests data on consensus price targets, forecasted revenue and earnings figures, as well as the transcripts of earnings calls to produce qualitative analysis. The narratives produced by AnalystLowTarget are general in nature and are based solely on analyst data and publicly-available material published by the respective companies. These scenarios are not indicative of the company's future performance and are exploratory in nature. Simply Wall St has no position in the company(s) mentioned. Simply Wall St may provide the securities issuer or related entities with website advertising services for a fee, on an arm's length basis. These relationships have no impact on the way we conduct our business, the content we host, or how our content is served to users. The price targets and estimates used are consensus data, and do not constitute a recommendation to buy or sell any stock, and they do not take account of your objectives, or your financial situation. Note that AnalystLowTarget's analysis may not factor in the latest price-sensitive company announcements or qualitative material.


