

Last Update 24 Jun 26
MTARTECH: Rich Multiple Will Face Testing From Large Blanket Orders Execution
Analysts have slightly trimmed their price expectations for MTAR Technologies to reflect updated assumptions on discount rates, revenue growth, profit margins, and a lower future P/E multiple. This has resulted in a more conservative valuation in the latest price target revision.
What's in the News
- MTAR Technologies reported new purchase orders valued at US$48.68 million, equivalent to ₹4,673 million at an exchange rate of ₹96.00, from an existing international customer, with execution split between March 20, 2027 and June 20, 2027. (Source: Client Announcement)
- The company also disclosed blanket purchase orders worth US$238.76 million, or ₹22,789.6 million at an exchange rate of ₹95.50, from an existing international customer, with the time period for execution to be decided later. (Source: Client Announcement)
- MTAR Technologies raised its earnings guidance for fiscal year 2027 and updated expected revenue growth from 50% to a range centered around 80%, plus or minus 5%. (Source: Corporate Guidance)
- A board meeting is scheduled for May 12, 2026 at 14:00 Indian Standard Time to consider audited standalone and consolidated financial results and audit reports for the quarter and year ended March 31, 2026, along with other business with the permission of the Chair. (Source: Board Meeting Notice)
Valuation Changes for MTAR Technologies
- Fair Value: Modelled fair value remains unchanged at ₹7,358.25 per share, indicating no adjustment to the central valuation output.
- Discount Rate: The discount rate has risen slightly from 14.45% to 14.55%, reflecting a modestly higher required return in the updated model.
- Revenue Growth: Forecast revenue growth has been trimmed slightly from 87.47% to 87.10%, signalling a small reduction in top line expectations for MTAR Technologies.
- Net Profit Margin: The assumed net profit margin has edged down from 14.13% to 13.97%, implying a marginally more conservative earnings profile in the projections.
- Future P/E: The future P/E multiple has fallen meaningfully from 47.18x to 41.37x, pointing to a lower valuation multiple being applied to MTAR Technologies in the updated assessment.
Key Takeaways
- Government and private sector investments in nuclear, clean energy, and defense position MTAR for long-term growth, expanding its addressable market and recurring revenue streams.
- Ongoing automation and facility upgrades are set to boost operational efficiency and margins, enhancing profitability as demand scales across strategic sectors.
- High working capital needs, customer concentration, debt-funded expansion, diversification risks, and regulatory changes threaten profitability, cash flow, growth, and long-term competitiveness.
Catalysts
About MTAR Technologies- A precision engineering solutions company, develops, manufactures, and sells high precision, heavy equipment, components, and machines in India and internationally.
- MTAR is poised to benefit from accelerating multi-year investments in India's civil nuclear power sector, with large orders (~₹1,000 crore expected in 3–6 months) for new and refurbishment reactor projects, a dedicated facility being set up to address growing demand, and an order pipeline extending over several years; this will structurally raise revenue visibility and support long-term earnings growth.
- Sharply rising global data center energy needs and the shift to low-carbon power are driving higher demand for Bloom Energy's fuel cells, with MTAR set to capture a higher wallet share (25–35% growth in order forecasts from Bloom for FY'27, broader product assembly mandates), leading to step-jump expansion in clean energy revenues and a likely improvement in blended net margins due to operating leverage.
- Geopolitical tensions and defense capacity constraints in Europe and Israel are unlocking strong export opportunities for MTAR in high-value aerospace and defense components, with management guiding for 80% segment growth in FY'26; recurring contracts and expanding relationships (ISRO, DRDO, leading global OEMs) will enhance long-term revenue predictability.
- The company's continued investment in automation, specialized facilities (dedicated for oil & gas, nuclear), and process innovation is expected to lift operational efficiency and support margin expansion, favorably impacting EBITDA and ROCE as revenue scales.
- The ongoing shift towards indigenous manufacturing for strategic sectors under India's self-reliance initiative is driving higher domestic capex for defense, nuclear, and space, positioning MTAR as a preferred supplier for critical components and broadening its long-term addressable market, which supports sustained revenue growth and earnings resilience.
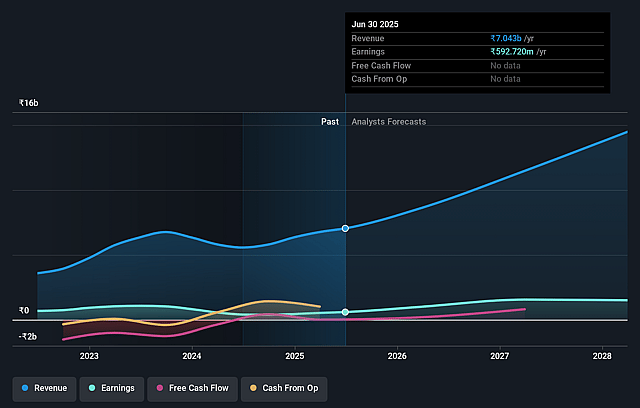
MTAR Technologies Future Earnings and Revenue Growth
Assumptions
How have these above catalysts been quantified?
- Analysts are assuming MTAR Technologies's revenue will grow by 87.1% annually over the next 3 years.
- Analysts assume that profit margins will increase from 10.7% today to 14.0% in 3 years time.
- Analysts expect earnings to reach ₹8.0 billion (and earnings per share of ₹260.7) by about June 2029, up from ₹940.3 million today.
- In order for the above numbers to justify the price target of the analysts, the company would need to trade at a PE ratio of 42.5x on those 2029 earnings, down from 265.7x today. This future PE is greater than the current PE for the IN Machinery industry at 27.8x.
- Analysts expect the number of shares outstanding to grow by 0.11% per year for the next 3 years.
- To value all of this in today's terms, we will use a discount rate of 14.55%, as per the Simply Wall St company report.
Risks
What could happen that would invalidate this narrative?- Persistent high working capital intensity (currently 267 days, with a target to reduce to 200 days) poses risks to free cash flow generation, especially as order execution in nuclear and aerospace ramps up; failure to manage this could pressure net margins and stretch the balance sheet.
- Heavy dependence on a few large customers, such as Bloom Energy and Indian government-linked defense/nuclear agencies, exposes MTAR to revenue volatility in the event of order delays, policy changes, or shifts in customer procurement strategies, risking future revenue and earnings visibility.
- Ambitious capacity expansions and new dedicated facilities (for nuclear and oil & gas) require substantial debt-funded capex (predominantly funded by term loans), adding leverage risk and heightening sensitivity to execution challenges; delays or underutilization can erode profitability and returns on capital.
- MTAR's strategy to diversify into new segments (clean energy, battery storage, oil & gas) and scale new product development increases operational and project execution risks; any failures in timely commercialization, technology scaling, or customer onboarding may result in cost overruns or delayed revenue realization, impacting EBITDA margins.
- Increases in global protectionist measures or regulatory changes (e.g., tariffs, local content requirements in export markets), combined with risk of technological obsolescence (such as shifts toward software-based solutions in automation/energy), may constrain MTAR's export growth potential or necessitate costly upgrades, thereby affecting both topline growth and long-term competitiveness.
Valuation
How have all the factors above been brought together to estimate a fair value?
- The analysts have a consensus price target of ₹7358.25 for MTAR Technologies based on their expectations of its future earnings growth, profit margins and other risk factors.
- However, there is a degree of disagreement amongst analysts, with the most bullish reporting a price target of ₹10007.0, and the most bearish reporting a price target of just ₹3650.0.
- In order for you to agree with the analysts, you'd need to believe that by 2029, revenues will be ₹57.4 billion, earnings will come to ₹8.0 billion, and it would be trading on a PE ratio of 42.5x, assuming you use a discount rate of 14.6%.
- Given the current share price of ₹8122.0, the analyst price target of ₹7358.25 is 10.4% lower. The relatively low difference between the current share price and the analyst consensus price target indicates that they believe on average, the company is fairly priced.
- We always encourage you to reach your own conclusions though. So sense check these analyst numbers against your own assumptions and expectations based on your understanding of the business and what you believe is probable.
Have other thoughts on MTAR Technologies?
Create your own narrative on this stock, and estimate its Fair Value using our Valuator tool.
Create NarrativeHow well do narratives help inform your perspective?
Disclaimer
AnalystConsensusTarget is a tool utilizing a Large Language Model (LLM) that ingests data on consensus price targets, forecasted revenue and earnings figures, as well as the transcripts of earnings calls to produce qualitative analysis. The narratives produced by AnalystConsensusTarget are general in nature and are based solely on analyst data and publicly-available material published by the respective companies. These scenarios are not indicative of the company's future performance and are exploratory in nature. Simply Wall St has no position in the company(s) mentioned. Simply Wall St may provide the securities issuer or related entities with website advertising services for a fee, on an arm's length basis. These relationships have no impact on the way we conduct our business, the content we host, or how our content is served to users. The price targets and estimates used are consensus data, and do not constitute a recommendation to buy or sell any stock, and they do not take account of your objectives, or your financial situation. Note that AnalystConsensusTarget's analysis may not factor in the latest price-sensitive company announcements or qualitative material.


