
Last Update 08 Sep 26
Fair value Increased 8.17%JSE: Share Buybacks Will Support Richer Margins And Future Upside
Analysts have raised the JSE price target from ZAR177.50 to ZAR192.00, reflecting slightly higher assumed profit margins, a modestly richer future P/E, and a small adjustment to the discount rate and revenue growth assumptions.
What’s in the News for JSE
- JSE Limited has an active share repurchase program that commenced on June 5, 2026, following shareholder approval at the Annual General Meeting held on May 13, 2026. Source, Key Developments.
- The share buyback mandate allows JSE to repurchase its own shares for up to 12 months after each repurchase, subject to the company and group being able to repay debts as they fall due. Source, Key Developments.
- The board has stated that the company and group assets are expected to exceed liabilities for 12 months after any repurchase under this program. Source, Key Developments.
- The general approval for the buyback program is set to remain in place until the earlier of the next JSE AGM or 15 months from the date of the ordinary resolution, unless renewed at that AGM. Source, Key Developments.
Valuation Changes for JSE
- Fair Value was raised from ZAR177.50 to ZAR192.00, representing a modest uplift in the JSE valuation anchor.
- The Discount Rate was adjusted slightly higher from 17.11% to 17.26%, indicating a marginally higher required return being used in the model.
- Revenue Growth was revised slightly lower from 4.37% to 4.10%, which reflects a more cautious ZAR revenue outlook in the assumptions.
- The Net Profit Margin moved marginally higher from 29.89% to 30.16%, reflecting a small change in expected profitability for JSE.
- The Future P/E increased from 17.40x to 18.88x, indicating a somewhat richer valuation multiple being used for the JSE earnings profile.
Key Takeaways
- Expansion of digital infrastructure and innovative product offerings are expected to boost operational efficiency, market participation, and earnings growth.
- Increased focus on sustainable investing and diversification into high-margin recurring revenues position JSE for stronger long-term performance.
- Weak economic fundamentals, rising competition, technology investment risks, and uncertain nontrading income growth threaten JSE's revenue stability, earnings potential, and margin resilience.
Catalysts
About JSE- Operates as a multi-asset class stock exchange in South Africa.
- Continued expansion and modernization of JSE's digital infrastructure-including the large-scale migration of post-trade systems to cloud-native, scalable platforms, rollout of new data products, and ongoing automation-are expected to drive long-term cost efficiencies, operational resilience, and higher net margins.
- JSE's growing focus on product innovation (launching new ETFs, derivatives, sustainability-linked instruments, and advanced analytics tools) supports increased market participation and trading activity, which should translate into higher transaction-based revenues and earnings growth.
- Increased wealth, financial inclusion, and a rising retail investor base across Africa is leading to sustained growth in trading volumes and demand for investment products, providing a strong outlook for higher core revenues.
- The global shift toward sustainable investing is likely to direct more capital to South African listed vehicles, boosting liquidity, demand for ESG-linked products and indices, and associated recurring fee income.
- Diversification into high-margin, recurring revenue streams (e.g., market data, post-trade, and information services), combined with the JSE's regional positioning as a leading African exchange, creates the potential for sustained earnings growth and future net margin expansion.
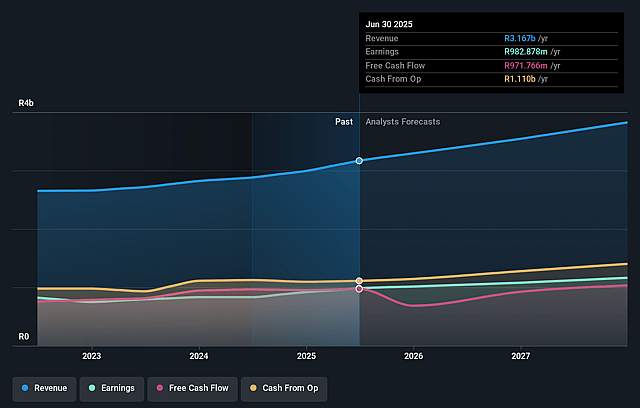
JSE Future Earnings and Revenue Growth
Assumptions
How have these above catalysts been quantified?
- Analysts are assuming JSE's revenue will grow by 4.1% annually over the next 3 years.
- Analysts assume that profit margins will shrink from 31.8% today to 30.2% in 3 years time.
- Analysts expect earnings to remain at the same level they are now, that being ZAR 1.2 billion (with an earnings per share of ZAR 16.23).
- In order for the above numbers to justify the price target of the analysts, the company would need to trade at a PE ratio of 19.0x on those 2029 earnings, up from 10.7x today. This future PE is greater than the current PE for the ZA Capital Markets industry at 8.9x.
- Analysts expect the number of shares outstanding to decline by 1.37% per year for the next 3 years.
- To value all of this in today's terms, we will use a discount rate of 17.26%, as per the Simply Wall St company report.
Risks
What could happen that would invalidate this narrative?- Persistent structural challenges in South Africa's economy, such as high unemployment, low GDP growth, and slow infrastructure investment, have yet to show meaningful translation to sustainable economic expansion, which over time could limit new listings, constrain trading activity, and negatively impact both JSE's revenue growth and long-term earnings.
- The recent surge in trading volumes, market volatility, and JSE share outperformance was partly driven by short-term external factors (e.g. global geopolitical tensions, currency volatility, event-driven portfolio rebalancing), which may not be sustainable, suggesting future trading activity and fee revenues could normalize or decline, impacting earnings growth.
- Competition risk is increasing, as highlighted by the emergence of rivals like A2X and alternative investment platforms, as well as the global shift toward private markets and alternative asset classes, potentially diverting liquidity and fee income away from the JSE and putting pressure on both revenue base and margins.
- Ongoing technology modernization and digital transformation projects, including migration of the core BDA system and investments in cloud infrastructure, require significant and rising personnel and technology spending; if project complexity, budget overruns, or delayed execution occur, these investments may outpace revenue growth and compress net margins.
- JSE's growing focus on diversifying income streams (e.g. information services, data products, post-trade services) delivers resilience but is not immune to cyclical or currency risks (e.g. dollar weakness, softer demand, once-off gains not repeating), and subdued or volatile nontrading income growth could undermine the stability and predictability of future earnings.
Valuation
How have all the factors above been brought together to estimate a fair value?
- The analysts have a consensus price target of ZAR192.0 for JSE based on their expectations of its future earnings growth, profit margins and other risk factors.
- In order for you to agree with the analysts, you'd need to believe that by 2029, revenues will be ZAR4.1 billion, earnings will come to ZAR1.2 billion, and it would be trading on a PE ratio of 19.0x, assuming you use a discount rate of 17.3%.
- Given the current share price of ZAR154.35, the analyst price target of ZAR192.0 is 19.6% higher.
- We always encourage you to reach your own conclusions though. So sense check these analyst numbers against your own assumptions and expectations based on your understanding of the business and what you believe is probable.
Have other thoughts on JSE?
Create your own narrative on this stock, and estimate its Fair Value using our Valuator tool.
Create NarrativeHow well do narratives help inform your perspective?
Comments
0 commentsDisclaimer
AnalystConsensusTarget is a tool utilizing a Large Language Model (LLM) that ingests data on consensus price targets, forecasted revenue and earnings figures, as well as the transcripts of earnings calls to produce qualitative analysis. The narratives produced by AnalystConsensusTarget are general in nature and are based solely on analyst data and publicly-available material published by the respective companies. These scenarios are not indicative of the company's future performance and are exploratory in nature. Simply Wall St has no position in the company(s) mentioned. Simply Wall St may provide the securities issuer or related entities with website advertising services for a fee, on an arm's length basis. These relationships have no impact on the way we conduct our business, the content we host, or how our content is served to users. The price targets and estimates used are consensus data, and do not constitute a recommendation to buy or sell any stock, and they do not take account of your objectives, or your financial situation. Note that AnalystConsensusTarget's analysis may not factor in the latest price-sensitive company announcements or qualitative material.
Read more narratives

Data And Infrastructure Modernisation Will Reshape This Exchange Over The Next Decade
View narrative