


Key Takeaways
- Robust tenant diversity mitigates economic risks, safeguarding net margins against sector-specific fluctuations.
- Strategic positioning and financial strength enable opportunistic investments and capitalize on growth trends, enhancing future revenue and earnings potential.
- Economic and market uncertainties could slow leasing, reduce development starts, and limit growth, impacting EastGroup Properties' future revenue and earnings.
Catalysts
About EastGroup Properties- EastGroup Properties, Inc. (NYSE: EGP), a member of the S&P Mid-Cap 400 and Russell 2000 Indexes, is a self-administered equity real estate investment trust focused on the development, acquisition and operation of industrial properties in major Sunbelt markets throughout the United States with an emphasis in the states of Texas, Florida, California, Arizona and North Carolina.
- EastGroup Properties is focusing on leasing to maintain high occupancy levels and making quicker leasing decisions, which could help stabilize or increase revenue despite market uncertainty.
- The company has strong geographic and revenue diversity, with its top 10 tenants accounting for only 7.1% of rents, potentially safeguarding future net margins by mitigating risks associated with economic fluctuations in specific sectors.
- EastGroup is well positioned to capitalize on development opportunities early compared to private peers due to its balance sheet strength, experience, and existing land and permits, potentially boosting future earnings as demand strengthens.
- Market dynamics such as population migration, nearshoring, onshoring, and evolving logistics chains are long-term positive trends expected to enhance EastGroup's portfolio quality and support future revenue growth.
- The company's balance sheet flexibility and record financial metrics, including a low debt-to-total market capitalization ratio, allows it to make opportunistic investments in uncertain economic climates, which could enhance future earnings potential.
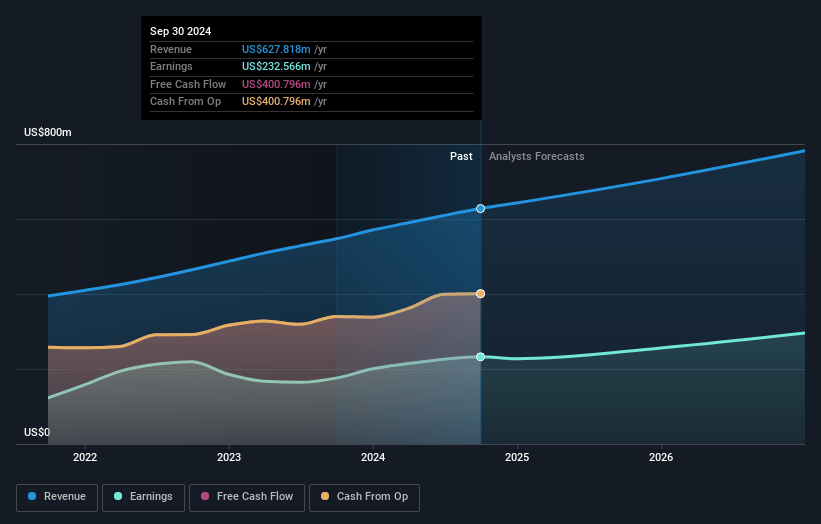
EastGroup Properties Future Earnings and Revenue Growth
Assumptions
How have these above catalysts been quantified?- Analysts are assuming EastGroup Properties's revenue will grow by 10.9% annually over the next 3 years.
- Analysts assume that profit margins will increase from 34.8% today to 36.8% in 3 years time.
- Analysts expect earnings to reach $330.1 million (and earnings per share of $5.84) by about May 2028, up from $228.5 million today. The analysts are largely in agreement about this estimate.
- In order for the above numbers to justify the analysts price target, the company would need to trade at a PE ratio of 44.8x on those 2028 earnings, up from 37.9x today. This future PE is greater than the current PE for the US Industrial REITs industry at 25.7x.
- Analysts expect the number of shares outstanding to grow by 7.0% per year for the next 3 years.
- To value all of this in today's terms, we will use a discount rate of 7.3%, as per the Simply Wall St company report.
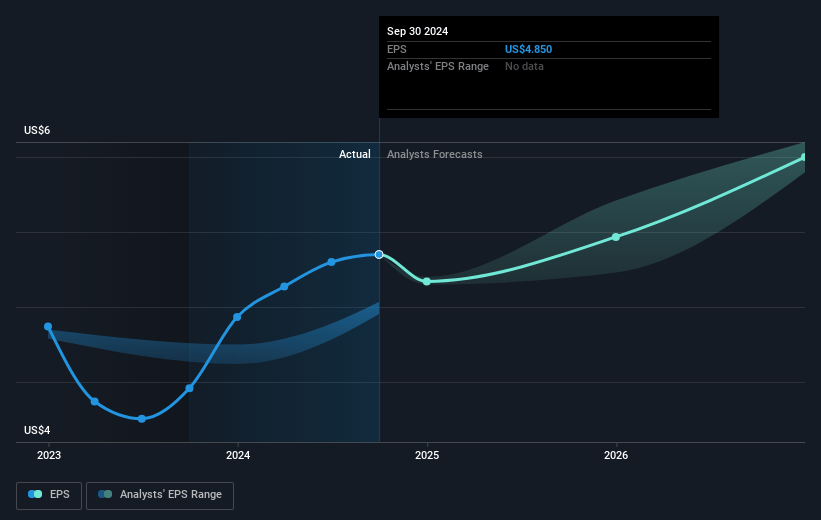
EastGroup Properties Future Earnings Per Share Growth
Risks
What could happen that would invalidate this narrative?- The tariff discussions have increased market uncertainty, which could impact tenant decisions and slow down leasing activity, potentially affecting EastGroup Properties' revenue.
- There is an expectation of slower and more deliberate decision-making from tenants, causing possible delays in both leasing and development projects, which could impact future earnings.
- EastGroup Properties has reduced its development starts and capital proceeds due to market uncertainty and volatility, which could affect future revenue growth.
- The company experiences market-specific challenges, such as signs of weakening in the Los Angeles market, which could influence net margins from lower rental income or higher vacancy rates.
- Rising construction and development costs combined with economic uncertainty have led to raised investment thresholds. This caution could limit opportunities and growth, impacting future earnings potential.
Valuation
How have all the factors above been brought together to estimate a fair value?- The analysts have a consensus price target of $186.842 for EastGroup Properties based on their expectations of its future earnings growth, profit margins and other risk factors. However, there is a degree of disagreement amongst analysts, with the most bullish reporting a price target of $218.0, and the most bearish reporting a price target of just $165.0.
- In order for you to agree with the analyst's consensus, you'd need to believe that by 2028, revenues will be $896.9 million, earnings will come to $330.1 million, and it would be trading on a PE ratio of 44.8x, assuming you use a discount rate of 7.3%.
- Given the current share price of $165.31, the analyst price target of $186.84 is 11.5% higher.
- We always encourage you to reach your own conclusions though. So sense check these analyst numbers against your own assumptions and expectations based on your understanding of the business and what you believe is probable.
How well do narratives help inform your perspective?
Disclaimer
AnalystConsensusTarget is a tool utilizing a Large Language Model (LLM) that ingests data on consensus price targets, forecasted revenue and earnings figures, as well as the transcripts of earnings calls to produce qualitative analysis. The narratives produced by AnalystConsensusTarget are general in nature and are based solely on analyst data and publicly-available material published by the respective companies. These scenarios are not indicative of the company's future performance and are exploratory in nature. Simply Wall St has no position in the company(s) mentioned. Simply Wall St may provide the securities issuer or related entities with website advertising services for a fee, on an arm's length basis. These relationships have no impact on the way we conduct our business, the content we host, or how our content is served to users. The price targets and estimates used are consensus data, and do not constitute a recommendation to buy or sell any stock, and they do not take account of your objectives, or your financial situation. Note that AnalystConsensusTarget's analysis may not factor in the latest price-sensitive company announcements or qualitative material.