

Key Takeaways
- Integrated selling and supply chain optimization enhance productivity and cost-efficiency, driving revenue and net margin growth.
- Commitment to innovation and sustainability bolsters brand positioning and competitive differentiation, supporting future revenue gains.
- Soft macroeconomic conditions, FX fluctuations, and rising expenses threaten Interface’s revenue growth and profitability in key markets.
Catalysts
About Interface- Designs, produces, and sells modular carpet products in the United States, Canada, Latin America, Europe, Africa, Asia, and Australia.
- Interface is focused on enhancing productivity through an integrated selling approach and expanding the reach of their product lines, which is expected to drive revenue growth by tapping into new segments and increasing order growth in key regions.
- The company's investment in automation and robotics at manufacturing plants is anticipated to increase operational efficiency and expand gross profit margins, positively impacting earnings.
- Interface has streamlined supply chain management and appointed a Chief Supply Chain Officer to drive productivity improvements, which will help optimize costs and expand net margins.
- The company's commitment to design, innovation, and sustainability, including targeting carbon negativity by 2040, is likely to improve brand positioning and competitively differentiate Interface, supporting revenue growth.
- Strategic investments in manufacturing and automation are expected to yield a high return on capital, increasing production efficiency and contributing to higher net margins.
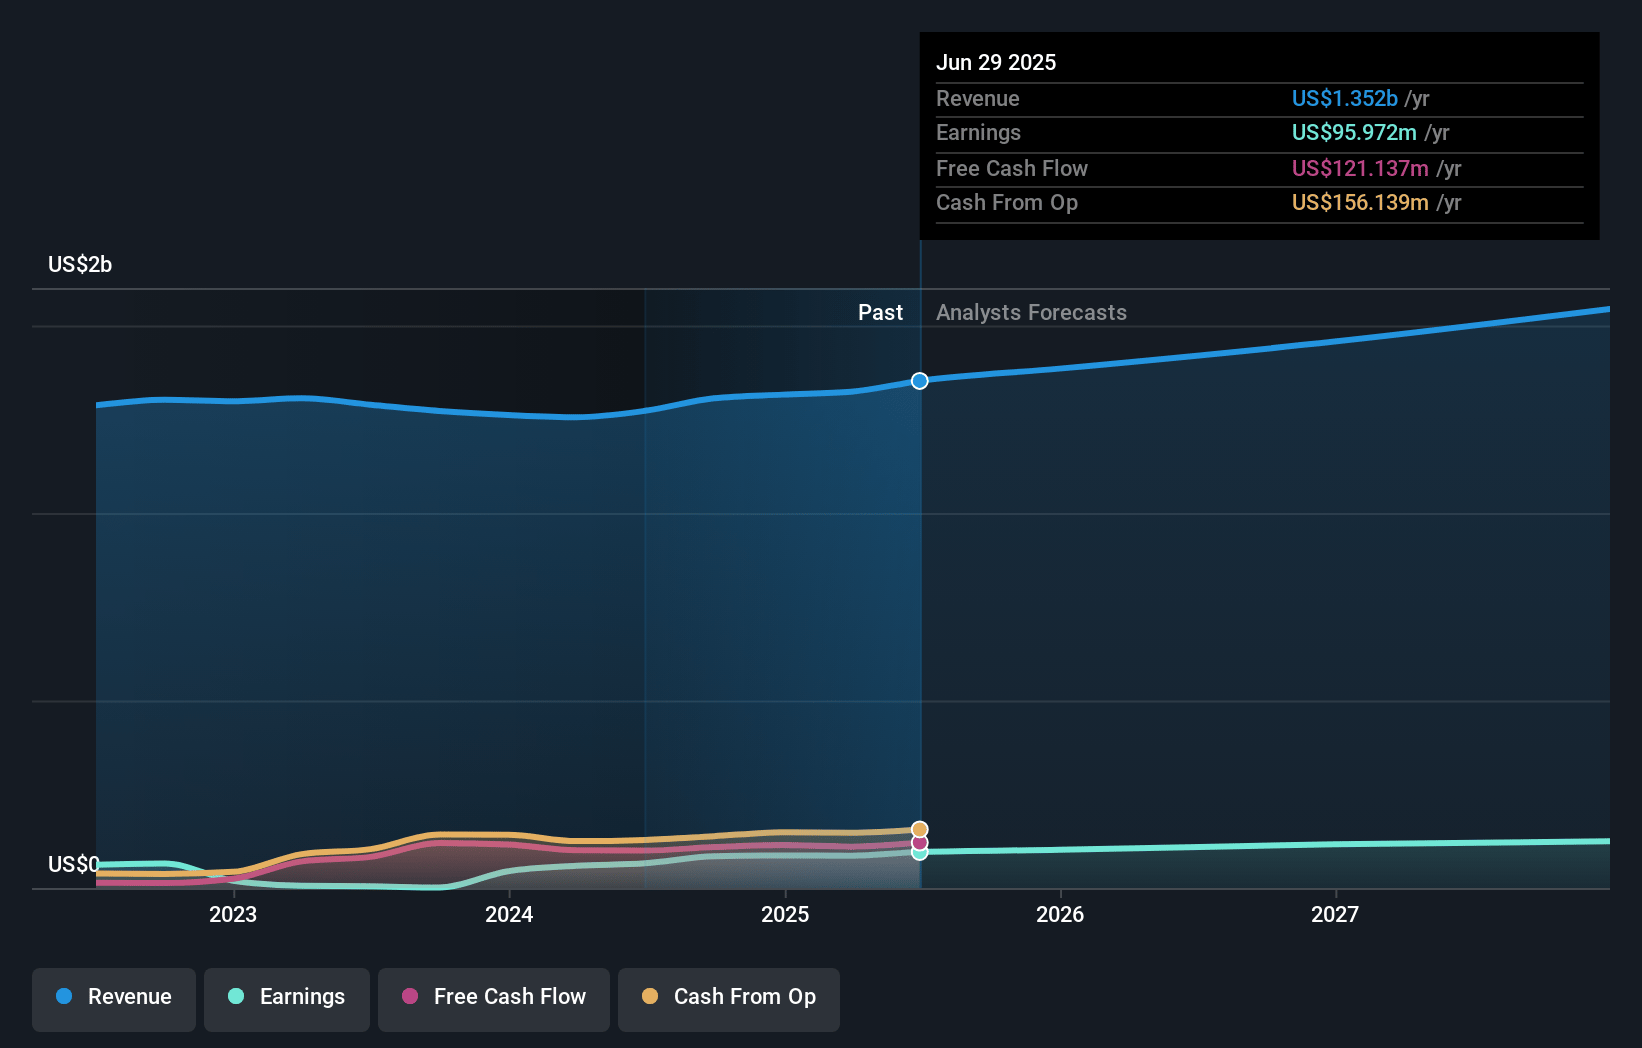
Interface Future Earnings and Revenue Growth
Assumptions
How have these above catalysts been quantified?- Analysts are assuming Interface's revenue will grow by 4.1% annually over the next 3 years.
- Analysts assume that profit margins will increase from 6.6% today to 7.9% in 3 years time.
- Analysts expect earnings to reach $116.8 million (and earnings per share of $2.0) by about May 2028, up from $86.9 million today.
- In order for the above numbers to justify the analysts price target, the company would need to trade at a PE ratio of 19.1x on those 2028 earnings, up from 12.8x today. This future PE is lower than the current PE for the US Commercial Services industry at 27.7x.
- Analysts expect the number of shares outstanding to grow by 0.12% per year for the next 3 years.
- To value all of this in today's terms, we will use a discount rate of 7.15%, as per the Simply Wall St company report.
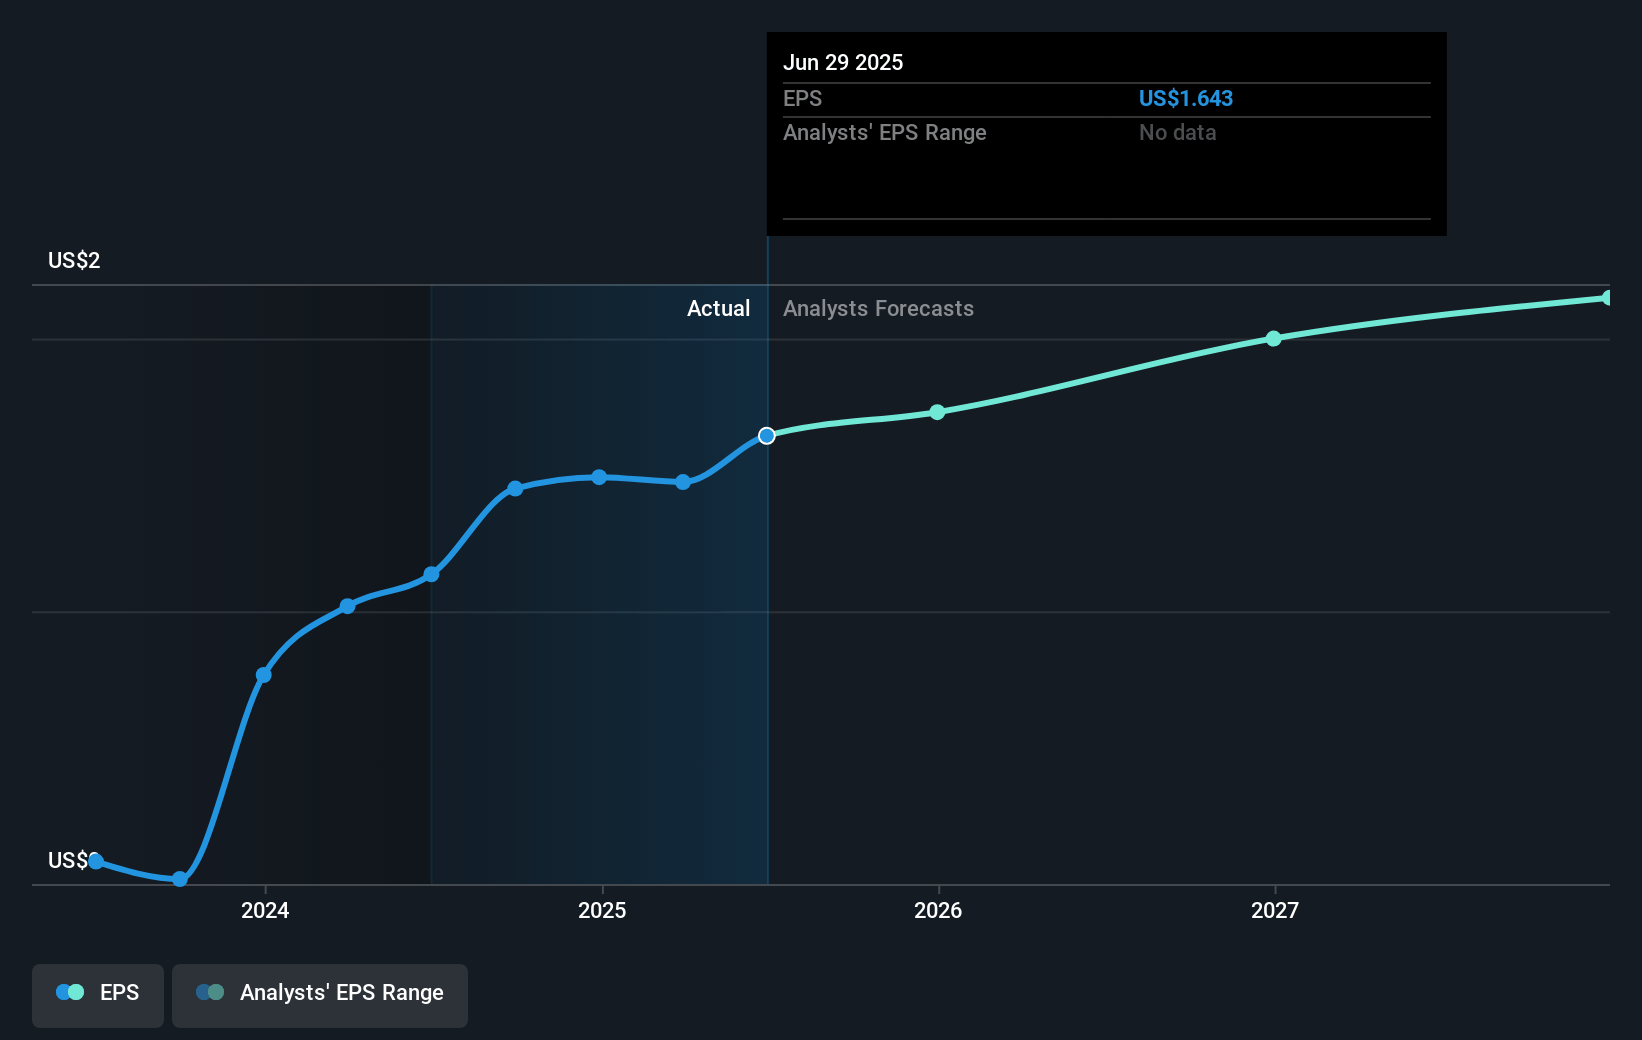
Interface Future Earnings Per Share Growth
Risks
What could happen that would invalidate this narrative?- The macroeconomic environment in Europe and Australia remains soft, which could negatively impact revenues from these regions and overall financial performance.
- Challenges in the corporate office segment, which saw a decline in global billings, suggest potential threats to revenue growth from this market.
- Foreign exchange rate fluctuations, particularly the strong U.S. dollar, are expected to negatively impact year-over-year net sales growth, affecting overall revenue and profitability.
- Rising SG&A expenses, primarily due to increased sales commissions and variable compensation in line with stronger performance, could compress net margins if not managed effectively.
- The potential impact of new tariffs, particularly with respect to raw material sourcing, although currently limited, poses a risk to production costs and net margins if supply chain adjustments are required.
Valuation
How have all the factors above been brought together to estimate a fair value?- The analysts have a consensus price target of $31.333 for Interface based on their expectations of its future earnings growth, profit margins and other risk factors.
- In order for you to agree with the analyst's consensus, you'd need to believe that by 2028, revenues will be $1.5 billion, earnings will come to $116.8 million, and it would be trading on a PE ratio of 19.1x, assuming you use a discount rate of 7.2%.
- Given the current share price of $18.99, the analyst price target of $31.33 is 39.4% higher.
- We always encourage you to reach your own conclusions though. So sense check these analyst numbers against your own assumptions and expectations based on your understanding of the business and what you believe is probable.
How well do narratives help inform your perspective?
Disclaimer
Warren A.I. is a tool utilizing a Large Language Model (LLM) that ingests data on consensus price targets, forecasted revenue and earnings figures, as well as the transcripts of earnings calls to produce qualitative analysis. The narratives produced by Warren A.I. are general in nature and are based solely on analyst data and publicly-available material published by the respective companies. These scenarios are not indicative of the company's future performance and are exploratory in nature. Simply Wall St has no position in the company(s) mentioned. Simply Wall St may provide the securities issuer or related entities with website advertising services for a fee, on an arm's length basis. These relationships have no impact on the way we conduct our business, the content we host, or how our content is served to users. The price targets and estimates used are consensus data, and do not constitute a recommendation to buy or sell any stock, and they do not take account of your objectives, or your financial situation. Note that Warren A.I.'s analysis may not factor in the latest price-sensitive company announcements or qualitative material.