


Key Takeaways
- Expanded global footprint and aftermarket growth boost stability, but high leverage, integration risks, and soft OEM demand pressure profitability and limit margin expansion.
- Vertical integration and favorable supply chain trends offer long-term potential, yet ramp-up costs, pricing pressures, and macro risks constrain profits and growth outlook.
- Heavy dependence on cyclical agribusiness, intensifying competition, rising leverage, and evolving industry trends expose Randoncorp to persistent margin, earnings, and market share risks.
Catalysts
About Randoncorp- Manufactures and sells trailers and semi-trailers in Latin America and internationally.
- While Randoncorp's increased revenue from international expansion and diversification-especially through the recent acquisitions of Dacomsa, AXN, and Delta-creates a larger, more stable revenue base and access to growth markets in North America and EMEA, the company faces elevated leverage with net debt to EBITDA near 3x and rising interest costs, which could constrain future investment and margin expansion if operational synergies materialize slower than expected.
- Despite the growing aftermarket business supporting resilient, higher-margin sales and capitalizing on global trends for supply chain modernization, Randoncorp's core OEM segment remains vulnerable to cyclical downturns, as illustrated by steep declines in agribusiness-related trailer demand, which reduces the operating leverage and keeps overall net margins under pressure.
- Even though regulatory pushes for cleaner, safer truck fleets and the expansion of e-commerce should drive long-term demand for new, technologically advanced trailers, Randoncorp's profitability is acutely exposed to ongoing intense price competition, a less favorable mix, and higher inventories, limiting its ability to pass on input cost inflation and sustain EBITDA margins through economic cycles.
- While scaling vertically into auto parts and financial services increases vertical integration and operational efficiency, significant ramp-up costs in new production sites and product lines are delaying positive contributions to group margins and returns on invested capital, as seen in weaker ROIC and diluted group profitability in the near term.
- Although uncertainty around global tariff regimes, regionalization of supply chains, and North American trade tensions could ultimately favor non-Chinese suppliers like Randoncorp, these same macroeconomic and political risks create volatility in export revenues, disrupt cross-border synergies, and could impede volume recovery or pricing stability, impacting medium
- to long-term revenue growth.
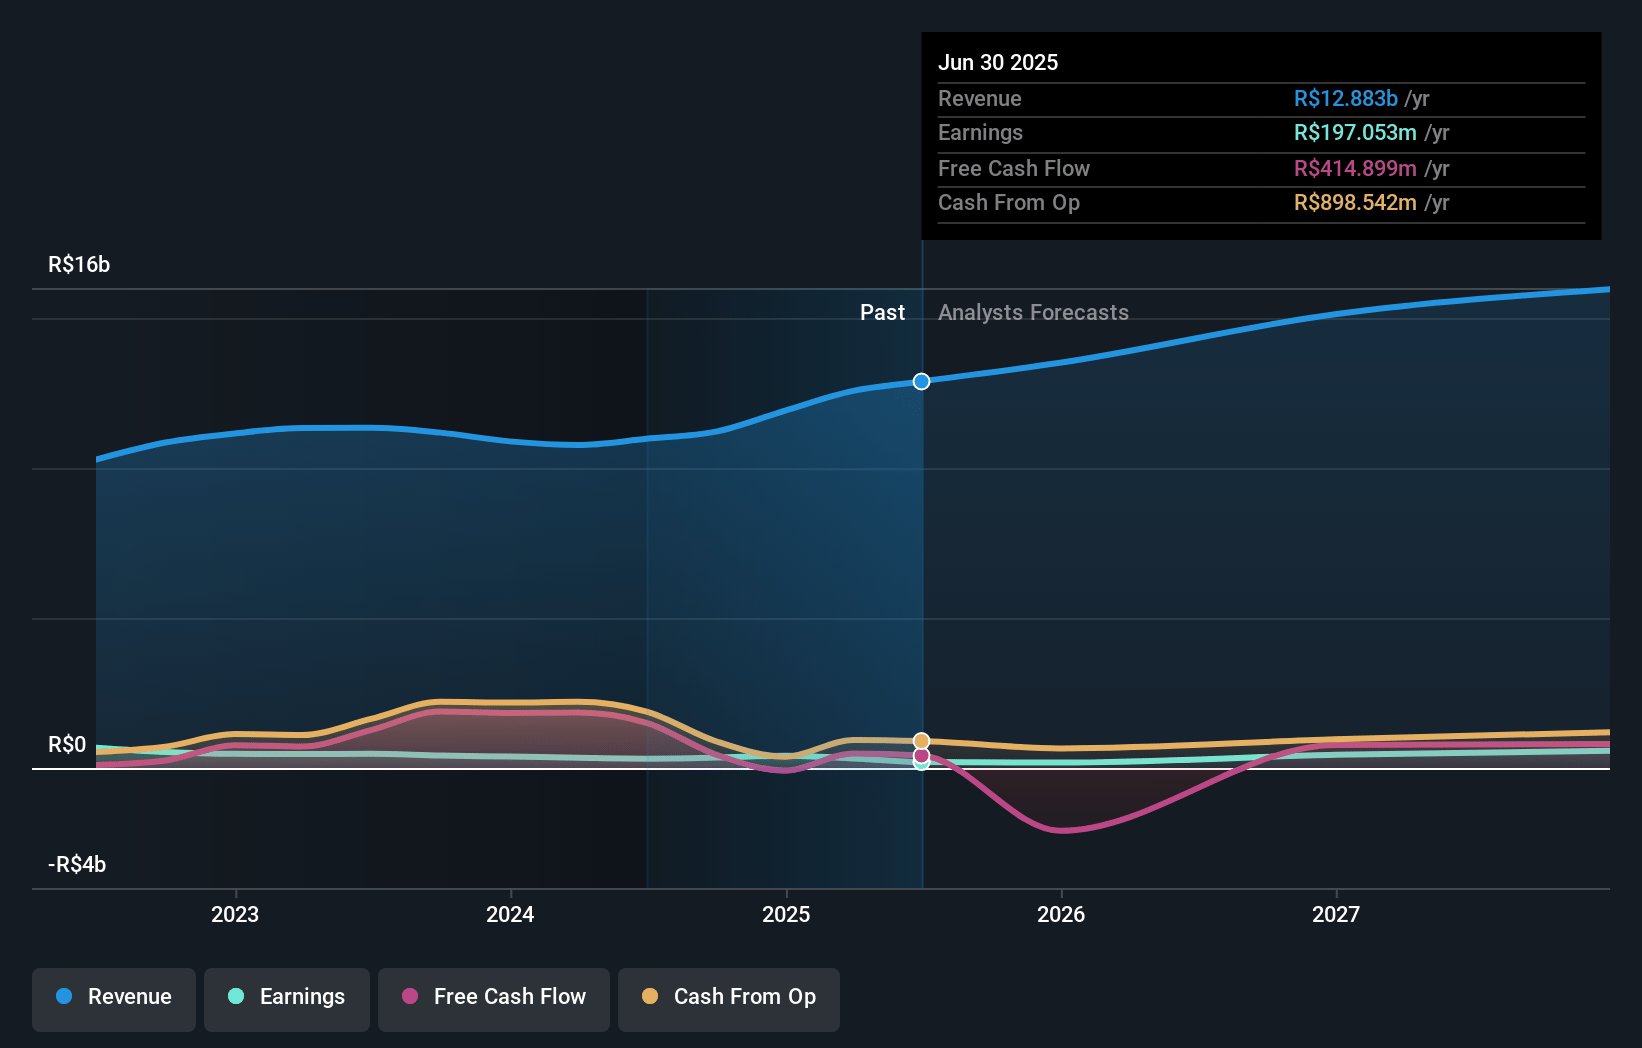
Randoncorp Future Earnings and Revenue Growth
Assumptions
How have these above catalysts been quantified?- This narrative explores a more pessimistic perspective on Randoncorp compared to the consensus, based on a Fair Value that aligns with the bearish cohort of analysts.
- The bearish analysts are assuming Randoncorp's revenue will grow by 8.0% annually over the next 3 years.
- The bearish analysts assume that profit margins will increase from 2.5% today to 3.6% in 3 years time.
- The bearish analysts expect earnings to reach R$574.3 million (and earnings per share of R$1.94) by about July 2028, up from R$319.0 million today. The analysts are largely in agreement about this estimate.
- In order for the above numbers to justify the price target of the more bearish analyst cohort, the company would need to trade at a PE ratio of 10.4x on those 2028 earnings, up from 7.3x today. This future PE is greater than the current PE for the BR Machinery industry at 7.3x.
- Analysts expect the number of shares outstanding to remain consistent over the next 3 years.
- To value all of this in today's terms, we will use a discount rate of 26.52%, as per the Simply Wall St company report.
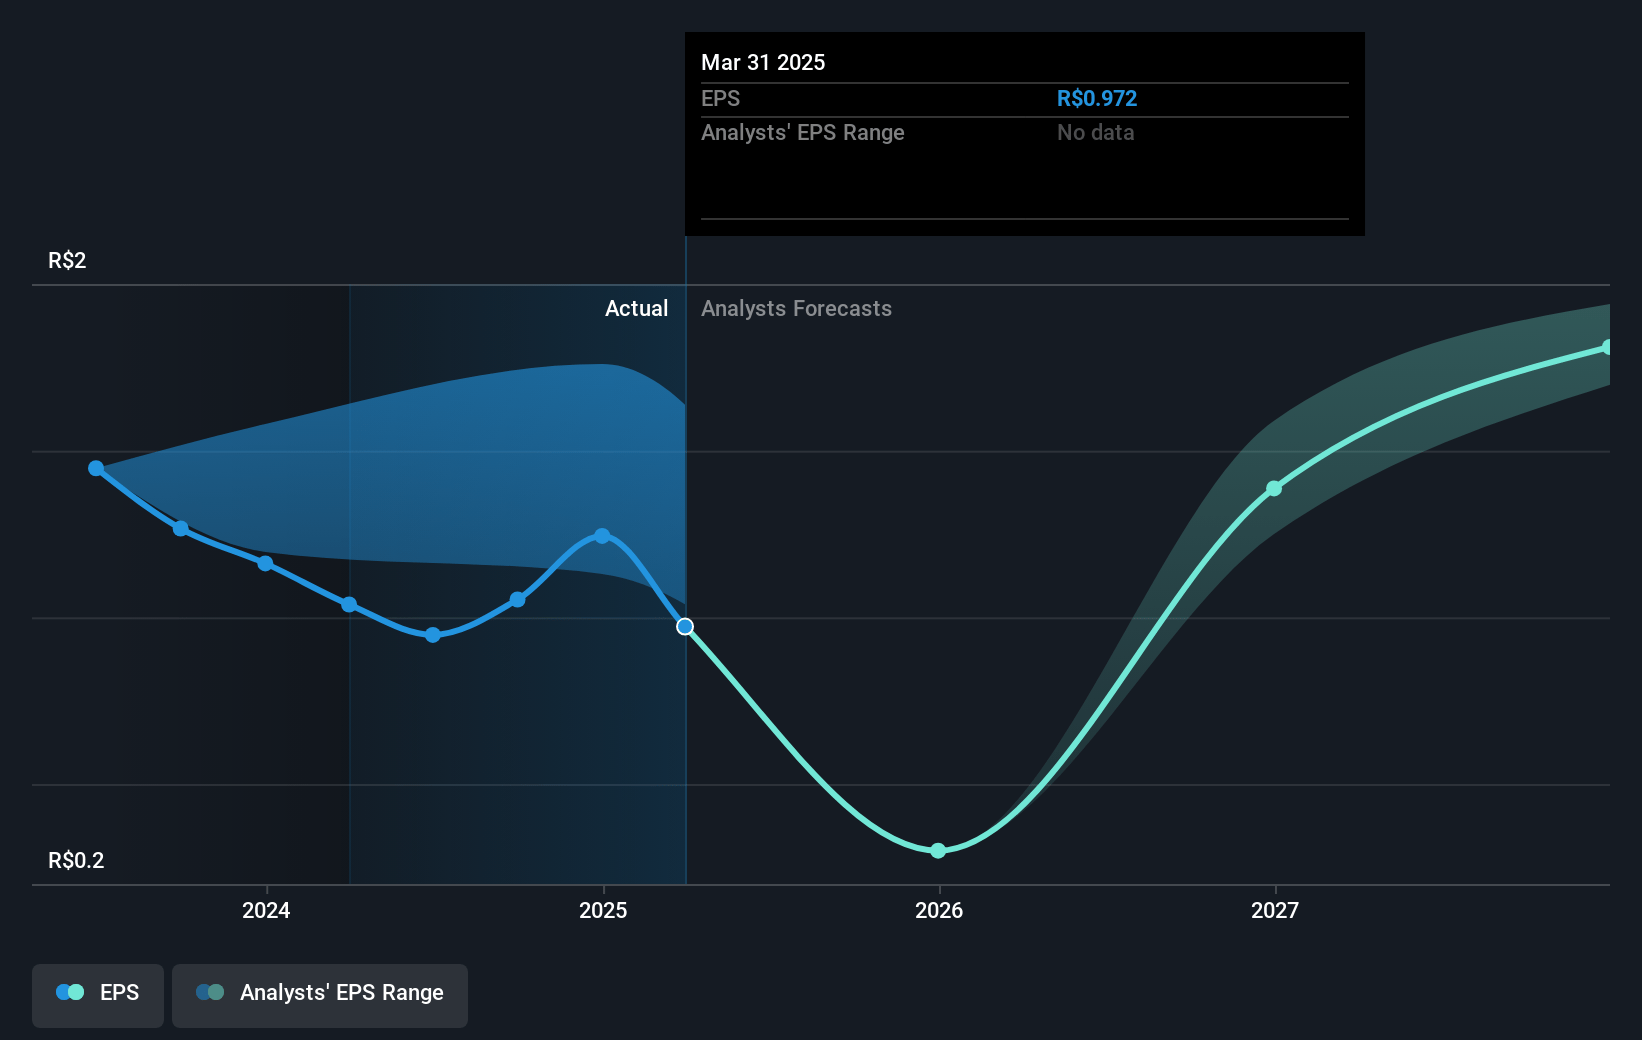
Randoncorp Future Earnings Per Share Growth
Risks
What could happen that would invalidate this narrative?- High exposure to the cyclical agribusiness sector, which currently accounts for 60% to 70% of OEM demand, poses a risk as the company's product mix is vulnerable to prolonged slowdowns in agricultural investment and low renewal rates for heavy vehicles, potentially leading to persistent pressure on revenue and gross margins.
- Intensifying price competition in the trailer OEM segment, following recent capacity additions and accumulated inventory among competitors, is creating sustained margin compression as passing on price increases is difficult in a high-interest-rate environment, negatively impacting net margins and EBITDA.
- The recent series of acquisitions have sharply increased leverage to a peak level around three times EBITDA, with much of current cash flow being committed to integration and synergy capture; delays or under-delivery on synergies could strain balance sheet flexibility, pressuring earnings and increasing financial risk.
- Ongoing policy and tariff uncertainties in key export markets such as the United States create a volatile backdrop, with the risk of trade barriers or stagnating investment due to deglobalization trends possibly dampening long-term international revenue growth and profitability.
- The shift in global logistics and transport toward electrification, automation, and regionalization may challenge Randoncorp if its R&D cadence does not keep up-especially as the company remains heavily exposed to traditional vehicle platforms-which could erode both top-line growth and future market share.
Valuation
How have all the factors above been brought together to estimate a fair value?- The assumed bearish price target for Randoncorp is R$9.0, which represents the lowest price target estimate amongst analysts. This valuation is based on what can be assumed as the expectations of Randoncorp's future earnings growth, profit margins and other risk factors from analysts on the more bearish end of the spectrum.
- However, there is a degree of disagreement amongst analysts, with the most bullish reporting a price target of R$16.0, and the most bearish reporting a price target of just R$9.0.
- In order for you to agree with the bearish analysts, you'd need to believe that by 2028, revenues will be R$15.8 billion, earnings will come to R$574.3 million, and it would be trading on a PE ratio of 10.4x, assuming you use a discount rate of 26.5%.
- Given the current share price of R$7.13, the bearish analyst price target of R$9.0 is 20.8% higher.
- We always encourage you to reach your own conclusions though. So sense check these analyst numbers against your own assumptions and expectations based on your understanding of the business and what you believe is probable.
How well do narratives help inform your perspective?
Disclaimer
AnalystLowTarget is a tool utilizing a Large Language Model (LLM) that ingests data on consensus price targets, forecasted revenue and earnings figures, as well as the transcripts of earnings calls to produce qualitative analysis. The narratives produced by AnalystLowTarget are general in nature and are based solely on analyst data and publicly-available material published by the respective companies. These scenarios are not indicative of the company's future performance and are exploratory in nature. Simply Wall St has no position in the company(s) mentioned. Simply Wall St may provide the securities issuer or related entities with website advertising services for a fee, on an arm's length basis. These relationships have no impact on the way we conduct our business, the content we host, or how our content is served to users. The price targets and estimates used are consensus data, and do not constitute a recommendation to buy or sell any stock, and they do not take account of your objectives, or your financial situation. Note that AnalystLowTarget's analysis may not factor in the latest price-sensitive company announcements or qualitative material.


