


Key Takeaways
- Expansion in the U.S. and strategic acquisitions enhance scale, capacity, and revenue growth potential through partnerships and market penetration.
- Cost reduction and efficient operations improve margins and financial discipline, aiding stronger performance amidst rising demand from climate-related services.
- Unpredictable weather, project delays, and slower U.S. market entry challenge revenue growth, profitability, and investor confidence for Johns Lyng Group.
Catalysts
About Johns Lyng Group- Provides integrated building services in Australia, New Zealand, and the United States.
- The company is expanding its market presence in the U.S. with a scaled partnership with Brown & Brown, leading to expected increased job volumes and revenue contributions. This expansion should enhance revenue growth.
- The implementation of cost reduction measures and operational efficiencies is expected to improve financial discipline and margins, supporting a stronger performance in the second half of the year.
- Future demand for restoration and recovery services is anticipated to rise due to climate change causing more frequent and severe natural disasters, potentially driving long-term revenue growth.
- The acquisition of Keystone Group in Australia and further strategic acquisitions are expected to enhance the company's scale and capacity, positively impacting revenue and net margins.
- Stronger registration rates and key contract wins in Australia are laying a solid foundation for future revenue growth, as operating conditions improve and the full effect of recent strategic decisions is realized.
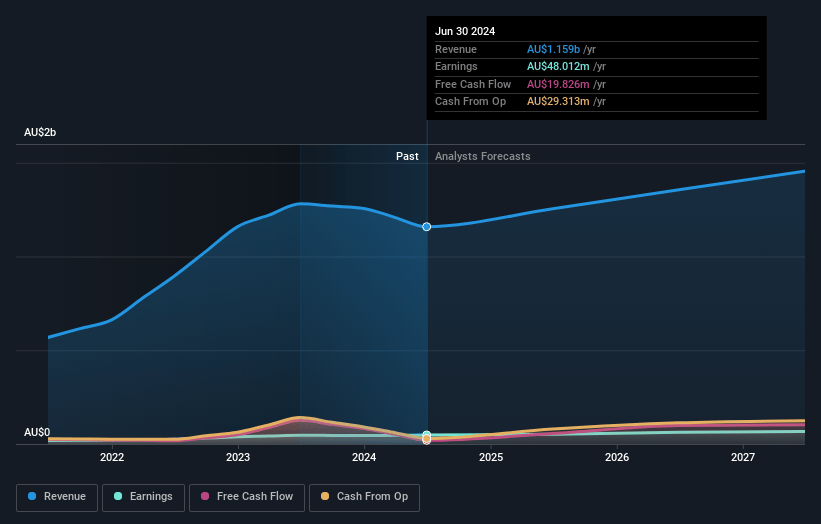
Johns Lyng Group Future Earnings and Revenue Growth
Assumptions
How have these above catalysts been quantified?- Analysts are assuming Johns Lyng Group's revenue will grow by 7.4% annually over the next 3 years.
- Analysts assume that profit margins will increase from 3.5% today to 4.6% in 3 years time.
- Analysts expect earnings to reach A$63.4 million (and earnings per share of A$0.22) by about May 2028, up from A$39.1 million today. However, there is a considerable amount of disagreement amongst the analysts with the most bullish expecting A$70.8 million in earnings, and the most bearish expecting A$47.9 million.
- In order for the above numbers to justify the analysts price target, the company would need to trade at a PE ratio of 18.6x on those 2028 earnings, up from 16.1x today. This future PE is greater than the current PE for the AU Construction industry at 16.2x.
- Analysts expect the number of shares outstanding to grow by 1.04% per year for the next 3 years.
- To value all of this in today's terms, we will use a discount rate of 7.77%, as per the Simply Wall St company report.
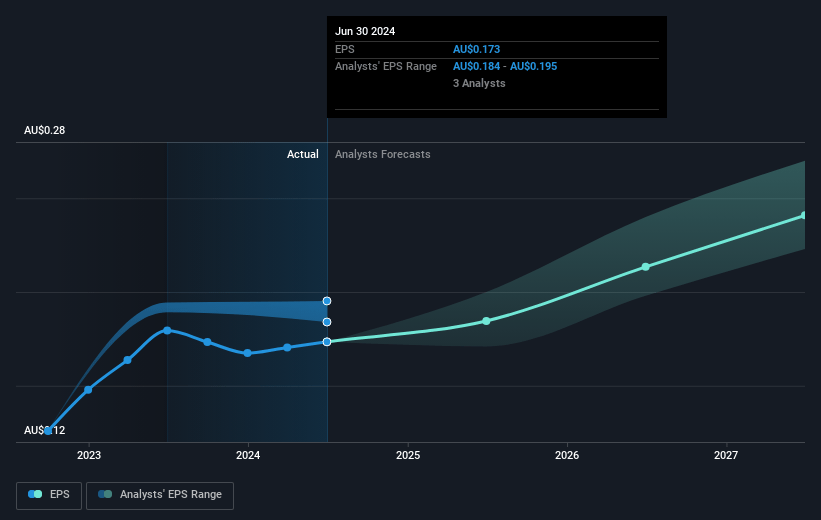
Johns Lyng Group Future Earnings Per Share Growth
Risks
What could happen that would invalidate this narrative?- Benign weather conditions in Australia led to lower insurance claim volumes, reducing CAT revenue and affecting overall group revenue and margins. This unpredictability in weather patterns can continue to negatively impact future revenues and net margins if similar conditions persist.
- Delays in project commencements in both the Northern Rivers region of New South Wales and in the U.S. contributed to slower revenue growth, highlighting execution risks that could impact revenue timing and the group's ability to meet earnings forecasts.
- A guidance revision for FY '25 indicates potential difficulties in maintaining previous growth projections, with expected EBITDA and revenue down 4.5% and 5% respectively from prior guidance, which may impact investor confidence and future earnings outlook.
- Although scaling efforts in the U.S. market show potential, initial results seem slower than anticipated, with first-half revenues and EBITDA under pressure due to project delays. This suggests heightened market entry and operational execution risks that could affect revenue and profitability targets abroad.
- High dependence on acquisitions for BaU growth introduces integration risks. The Keystone Group acquisition has not yet achieved planned margin improvements, impacting profitability and highlighting potential challenges in achieving operational efficiencies or desired financial performance from acquired entities.
Valuation
How have all the factors above been brought together to estimate a fair value?- The analysts have a consensus price target of A$3.233 for Johns Lyng Group based on their expectations of its future earnings growth, profit margins and other risk factors. However, there is a degree of disagreement amongst analysts, with the most bullish reporting a price target of A$4.3, and the most bearish reporting a price target of just A$2.4.
- In order for you to agree with the analyst's consensus, you'd need to believe that by 2028, revenues will be A$1.4 billion, earnings will come to A$63.4 million, and it would be trading on a PE ratio of 18.6x, assuming you use a discount rate of 7.8%.
- Given the current share price of A$2.22, the analyst price target of A$3.23 is 31.3% higher.
- We always encourage you to reach your own conclusions though. So sense check these analyst numbers against your own assumptions and expectations based on your understanding of the business and what you believe is probable.
How well do narratives help inform your perspective?
Disclaimer
AnalystConsensusTarget is a tool utilizing a Large Language Model (LLM) that ingests data on consensus price targets, forecasted revenue and earnings figures, as well as the transcripts of earnings calls to produce qualitative analysis. The narratives produced by AnalystConsensusTarget are general in nature and are based solely on analyst data and publicly-available material published by the respective companies. These scenarios are not indicative of the company's future performance and are exploratory in nature. Simply Wall St has no position in the company(s) mentioned. Simply Wall St may provide the securities issuer or related entities with website advertising services for a fee, on an arm's length basis. These relationships have no impact on the way we conduct our business, the content we host, or how our content is served to users. The price targets and estimates used are consensus data, and do not constitute a recommendation to buy or sell any stock, and they do not take account of your objectives, or your financial situation. Note that AnalystConsensusTarget's analysis may not factor in the latest price-sensitive company announcements or qualitative material.