What Happened in the Market This Week?
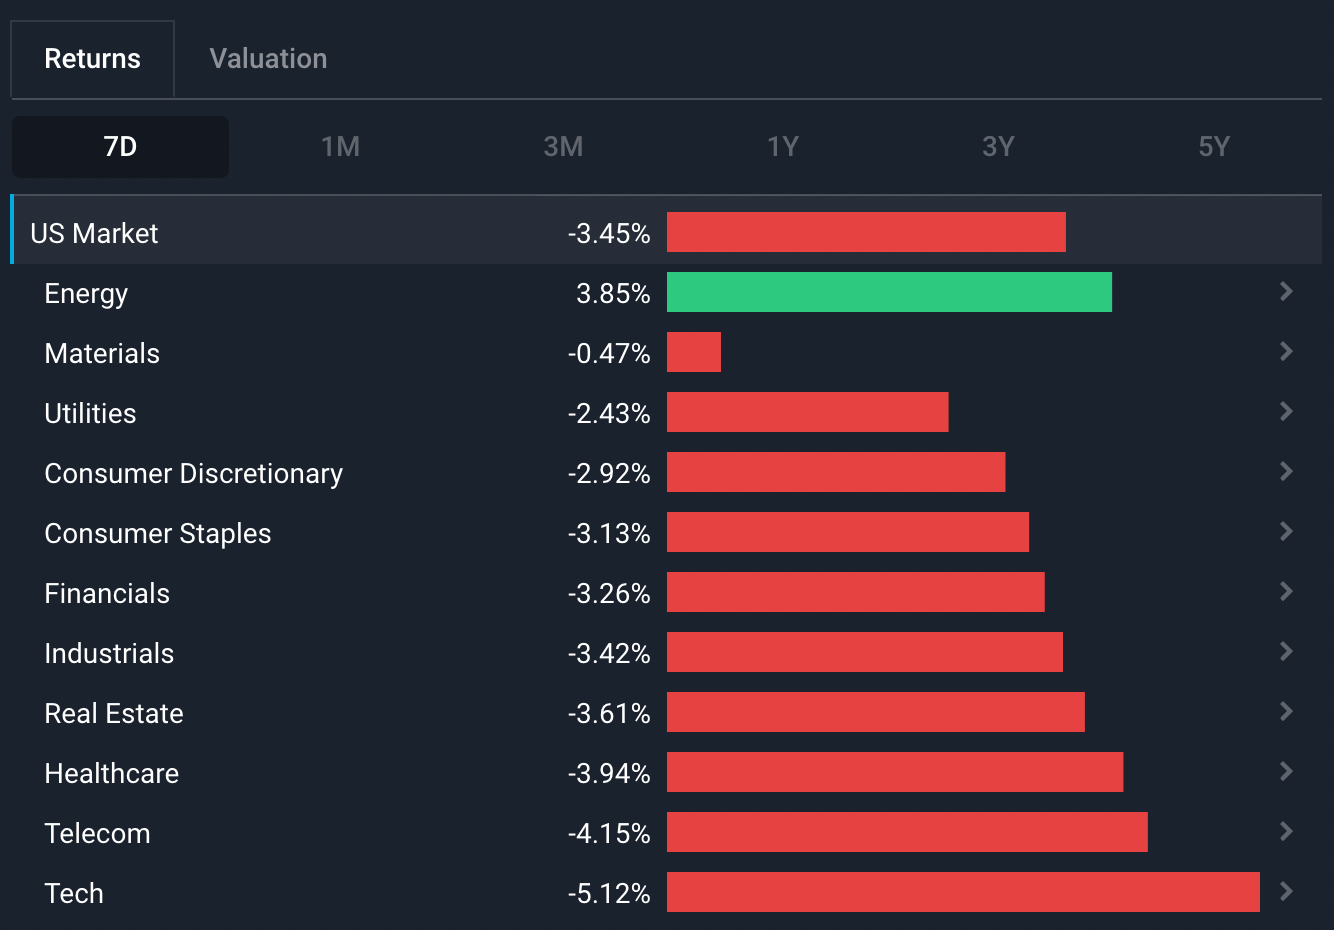
You’d be forgiven for thinking we’re on a roller coaster right now - markets are up one month, and down the next. Last week, equity markets fell slightly after a small rally from mid-June. The ‘risk-on’ Telecom , Consumer Discretionary and Real Estate sectors led the way down, while the only green sector was Energy because, you guessed it, oil bounced again.
Losses accelerated on Friday after Fed Chairman Jerome Powell gave a speech at the annual economic symposium at Jackson Hole, signalling that higher interest rates are here to stay.
Some of the developments we have been watching over the last week include:
- The economy isn’t actually all bad when we compare it to the pre-Covid economy - but mixed messages could lead to another round of stock market volatility.
- The oil price fell to $86 before rebounding to the mid $90s after Saudi Arabia's energy minister suggested OPEC could cut output if Iran re-entered the market.
How Does the Current Economy Compare to Pre-Covid Economy?
Listening to the media, we get mixed information - the labor market is strong and unemployment is at an all-time low. But at the same time, inflation is soaring and the Fed is planning to keep raising interest rates until next year. What gives?
As we mentioned in one of our previous Market Insights, the U.S. is either heading into a recession , or already in a mild recession . The rest of the world seems to be in a similar position, but generally lagging by a few months. But this is all just based on one number - the GDP growth rate. When we look at individual indicators, as mentioned, the picture is mixed.
The Covid-19 pandemic threw most of the economic indicators out of whack, so it’s not always helpful to compare current levels to those from 2020 and 2021. As such, we’ll be comparing their current levels to pre-pandemic levels to give you some insight on what’s different. Some indicators are actually looking quite good - while others look, to be quite frank, terrible.
✅ The 2022 U.S. Economy vs 2019 Pre-Covid: The Good
Some of the positive indicators include:
- The unemployment rate is down compared to 2019, while non-farm payrolls have been consistently higher than they were then.
- Household debt to GDP is up from 2019, but well below where it was for most of the previous decade.
- Retail sales are keeping pace with inflation which is pretty much what they were doing prior to 2020. Compared to pre-Covid, retail sales are in even higher levels.
U.S. 2017-2022 Retail Sales - Image Credit: tradingeconomics.com
❌ The 2022 U.S. Economy vs 2019 Pre-Covid: The Bad
We have covered the negatives extensively in previous Market Insights, but to recap briefly:
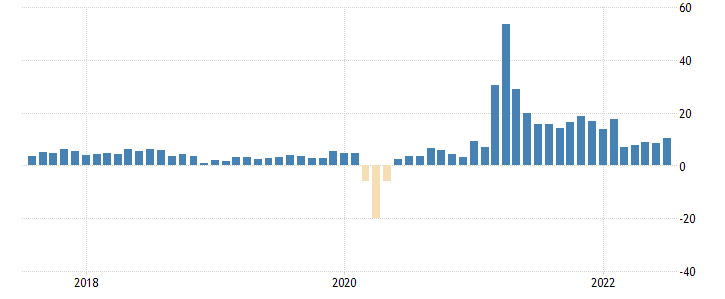
- GDP growth has been negative for the last two quarters, which means the U.S. is in a technical recession .
- Home sales are down in the U.S. and in many other countries .
- Inflation has surged to its highest level in 40 years .
- Consumer confidence is down significantly from 2019, and even worse than it was in 2020 when the population was locked down.

U.S. Consumer Confidence 2017-2022 - Image Credit: tradingeconomics.com
Will the stock market continue to be volatile?
The bottom line is that the data is already mixed. Now, if inflation continues to fall, it’s likely to be accompanied by weaker demand (i.e. lower growth), while a rebound in inflation would likely be accompanied by stronger demand (i.e. higher growth).
Either way, we are probably going to be getting a lot of mixed messages from the economic data over the next few months. And mixed messages lead to uncertainty, which typically leads to market volatility.
💡 The Insight: Asset Allocation in Market Volatility
Historically, gold and bonds have been a good hedge against volatility because they tended to rally when stock prices fell rapidly. However that hasn't been the best hedge over the last few years. The only effective hedge so far against this volatility in 2022 has been the U.S. dollar (given its increasing appeal compared to other currencies that aren’t raising rates as fast).
Planning your asset allocation, or how you divide your investments between different assets (e.g. cash, bonds, stocks), is increasingly important during times of volatility. This is because as you rebalance your portfolio, you need to keep in mind your personal risk appetite, investing time frame and investment goals.
For Short or Medium-Term Investors (< 5 years)
With inflation currently at 8%, there is a cost to holding cash because those dollars will be worth less in a year’s time (time value of money). However, with the uncertainty surrounding the overall economic environment, it’s common for investors to lose their appetite for risk - already evidenced by the movement of funds outside of the stock market.
A short investing time horizon is generally accompanied by a less aggressive asset allocation - after all, needing cash soon means that investing in a bond that gives a fixed rate of return is more appealing than a stock that could drop in value quickly.
👉 What’s worth remembering is that sometimes it's also worth holding some cash for non-financial reasons. Having access to your cash anytime helps you preserve that very important but often overlooked ' psychological capital 🧠.' Stock investors naturally have to accept a certain amount of volatility to generate good returns - but if that volatility will make you panic into emotional decisions or keep you up at night, it might be worth holding more cash to handle these big swings both financially and emotionally.
For Long-Term Investors (5+ years)
Generally, the longer your time horizon is, the more you can handle short term volatility. This is because time allows you to weather a downturn in the market.
💡 In Simply Wall St, we advocate a long-term approach to investing and encourage thinking in terms of narratives (i.e. well researched investment thesis that develops over time) to come up with a valuation and ultimately a decision. For example, if you believe that Electric Vehicles (EV) are the future of automobiles, then investing in EV stocks or in its components (e.g. Copper, Nickel, or Lithium ) may be a part of your investment approach. Other examples of investment narratives to give you ideas include being bullish on tech , believing that work-from-home will be a long-term trend , and believing that more actions will be taken against climate change .
As such, long-term investors may actually find great opportunities in slowing equity markets . This year, over $7 trillion in market value had been wiped out of blue chip stocks in the S&P 500, which means that some quality stocks are much cheaper than they were last year. For investors wanting to allocate more into equities but not knowing which stocks to invest in, building an investment narrative based on long term trends can be a good place to start.

In the last year, Tech, Consumer Discretionary, and Telecom have seen the largest losses in market value. These may be good places to start looking at for long-term investing.
Yes, Oil is Back Up Again 🛢️
When news that Russia invaded Ukraine first emerged in February, the price of Brent Crude Oil shot up to almost $125 as investors realized that oil supplies were going to be severely constrained. Within a month, some analysts were predicting that the price could reach $200 to $250 a barrel by the end of the year.

Brent Crude Oil Price Chart 2017-2022 - Image Credit: tradingeconomics.com
Of course, when prices rise, demand often falls. And when the oil price rises quickly, inflation rises (energy is part of the calculations for inflation), which means interest rates rise and economic growth forecasts fall - and so do forecasts for oil demand. In this case, the price didn’t stay above $100 for very long.
But oil prices are high again: Iran supply vs. OPEC+ supply
The oil price fell to $86 earlier in the month on speculation that a revived U.S. deal with Iran would once again allow Iran to sell oil to the global community, which would increase supply. However, the price then rebounded to $95 when Saudi Arabia’s energy minister suggested that the OPEC+ (Organization of the Petroleum Exporting Countries) members may cut production if Iran does indeed return to the market. This is due to OPEC's belief that existing recession fears in addition to new Iranian supply would push oil prices lower .
The U.S. and OPEC have since moderated these positions - at this stage we are really dealing with speculation and rhetoric. But the jump in oil prices has led to outperformance for oil stocks over the last week.

U.S. Oil Sector 7D Performance - 26th August 2022 - Simply Wall St
Why are oil prices so volatile?
Forecasting anything in the economy is difficult on the best of days, but forecasting the oil price is nigh on impossible. The oil industry is incredibly complex, and it isn’t simply a question of supply and demand. Besides the oil rigs that pump it out of the ground, each part of the supply chain from tankers to pipelines, refineries, and storage tanks have their own capacity constraints.
In addition to the supply chain, there’s a set of complex relationships between the prices of different types of oil (West Texas, Brent etc.), other energy products (gas and coal), and the futures markets for each product.
💡 As such, placing a lot of weight on short term oil price forecasts can lead to trouble, and in cases like these, it is generally better to think in probabilities, rather than absolutes. However, we do know 3 things: demand for energy rises over time, oil is a finite resource, and moving the world to renewables is proving to be a slow process . So with that in mind, investors might be better off contemplating where they think the price of oil will be in 5 years time and how particular stocks might be exposed to that potential outcome, rather than placing too much importance on the short-term price movements.
💡 The Insight: Investing in Energy
Despite its huge importance in our daily lives, energy stocks actually account for a relatively small percentage of the market value of most major stock indexes. Energy companies make up only between 4-6% of major stock indices such as the MSCI World Index and S&P 500. The one notable exception is the UK’s FTSE 100 index where energy stocks account for 12%.
👉 Aside from direct investments in energy, any company that uses substantial amounts of energy or transport is also negatively exposed to increased prices in oil or energy . When the oil price rises, their costs rise, and if they can’t pass those increases onto consumers, their profits fall. This includes most manufacturing, transport, food, and retail related industries - i.e. the industrial , consumer discretionary and consumer staples sectors. If you hold stocks in these industries and want to hedge against that downside risk, you may want to consider holding some of these energy stocks .
Key Events Next Week
The key economic indicators this week will be the U.S. unemployment rate and non-farm payrolls . Last month, these were a lot stronger than expected with a lower unemployment rate.
Otherwise it’s a quiet week for economic data. On Wednesday and Thursday, the Eurozone inflation rate and unemployment rate will be published. This will show whether current monetary policies have been effective in reducing inflation in the Eurozone.
On Thursday, the ISM manufacturing PMI will be published and will give investors a good indication of how business activity levels have changed from month to month. This data is one of the earliest economic indicators investors get since it is typically released on the first business day of every month.
Was this article helpful? Register for free with Simply Wall St to receive our weekly market insights straight to your inbox!
Until next week,
Invest Well,
Simply Wall St
Have feedback on this article? Concerned about the content? Get in touch with us directly. Alternatively, email editorial-team@simplywallst.com
Simply Wall St analyst Richard Bowman and Simply Wall St have no position in any of the companies mentioned. This article is general in nature. We provide commentary based on historical data and analyst forecasts only using an unbiased methodology and our articles are not intended to be financial advice. It does not constitute a recommendation to buy or sell any stock and does not take account of your objectives, or your financial situation. We aim to bring you long-term focused analysis driven by fundamental data. Note that our analysis may not factor in the latest price-sensitive company announcements or qualitative material.

Richard Bowman
Richard is an analyst, writer and investor based in Cape Town, South Africa. He has written for several online investment publications and continues to do so. Richard is fascinated by economics, financial markets and behavioral finance. He is also passionate about tools and content that make investing accessible to everyone.
