Stock Analysis
Woolworths Holdings' (JSE:WHL) investors will be pleased with their splendid 106% return over the last three years

One simple way to benefit from the stock market is to buy an index fund. But if you pick the right individual stocks, you could make more than that. Just take a look at Woolworths Holdings Limited (JSE:WHL), which is up 87%, over three years, soundly beating the market return of 17% (not including dividends). However, more recent returns haven't been as impressive as that, with the stock returning just 11% in the last year , including dividends .
Now it's worth having a look at the company's fundamentals too, because that will help us determine if the long term shareholder return has matched the performance of the underlying business.
Check out our latest analysis for Woolworths Holdings
To quote Buffett, 'Ships will sail around the world but the Flat Earth Society will flourish. There will continue to be wide discrepancies between price and value in the marketplace...' One flawed but reasonable way to assess how sentiment around a company has changed is to compare the earnings per share (EPS) with the share price.
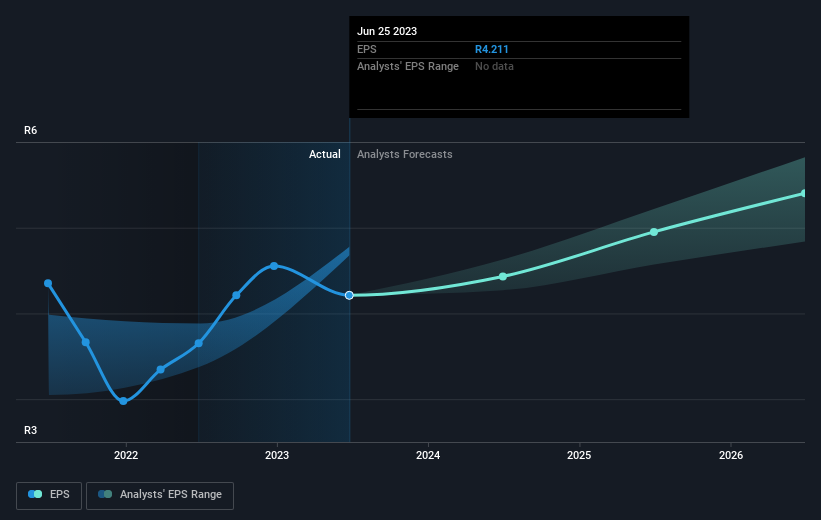
During three years of share price growth, Woolworths Holdings achieved compound earnings per share growth of 95% per year. This EPS growth is higher than the 23% average annual increase in the share price. So one could reasonably conclude that the market has cooled on the stock.
You can see how EPS has changed over time in the image below (click on the chart to see the exact values).
We know that Woolworths Holdings has improved its bottom line over the last three years, but what does the future have in store? You can see how its balance sheet has strengthened (or weakened) over time in this free interactive graphic.
What About Dividends?
When looking at investment returns, it is important to consider the difference between total shareholder return (TSR) and share price return. Whereas the share price return only reflects the change in the share price, the TSR includes the value of dividends (assuming they were reinvested) and the benefit of any discounted capital raising or spin-off. It's fair to say that the TSR gives a more complete picture for stocks that pay a dividend. As it happens, Woolworths Holdings' TSR for the last 3 years was 106%, which exceeds the share price return mentioned earlier. This is largely a result of its dividend payments!
A Different Perspective
We're pleased to report that Woolworths Holdings shareholders have received a total shareholder return of 11% over one year. And that does include the dividend. That gain is better than the annual TSR over five years, which is 9%. Therefore it seems like sentiment around the company has been positive lately. In the best case scenario, this may hint at some real business momentum, implying that now could be a great time to delve deeper. I find it very interesting to look at share price over the long term as a proxy for business performance. But to truly gain insight, we need to consider other information, too. To that end, you should be aware of the 1 warning sign we've spotted with Woolworths Holdings .
If you would prefer to check out another company -- one with potentially superior financials -- then do not miss this free list of companies that have proven they can grow earnings.
Please note, the market returns quoted in this article reflect the market weighted average returns of stocks that currently trade on South African exchanges.
Valuation is complex, but we're helping make it simple.
Find out whether Woolworths Holdings is potentially over or undervalued by checking out our comprehensive analysis, which includes fair value estimates, risks and warnings, dividends, insider transactions and financial health.
View the Free AnalysisHave feedback on this article? Concerned about the content? Get in touch with us directly. Alternatively, email editorial-team (at) simplywallst.com.
This article by Simply Wall St is general in nature. We provide commentary based on historical data and analyst forecasts only using an unbiased methodology and our articles are not intended to be financial advice. It does not constitute a recommendation to buy or sell any stock, and does not take account of your objectives, or your financial situation. We aim to bring you long-term focused analysis driven by fundamental data. Note that our analysis may not factor in the latest price-sensitive company announcements or qualitative material. Simply Wall St has no position in any stocks mentioned.
About JSE:WHL
Woolworths Holdings
Woolworths Holdings Limited, through its subsidiaries, operates a chain of retail stores in sub-Saharan Africa, Australia, and New Zealand.
Excellent balance sheet average dividend payer.

