Stock Analysis
- South Africa
- /
- Real Estate
- /
- JSE:ACS
Investors three-year returns in Acsion (JSE:ACS) have not grown faster than the company's underlying earnings growth


It's been a soft week for Acsion Limited (JSE:ACS) shares, which are down 14%. But don't let that distract from the very nice return generated over three years. To wit, the share price did better than an index fund, climbing 30% during that period.
While this past week has detracted from the company's three-year return, let's look at the recent trends of the underlying business and see if the gains have been in alignment.
View our latest analysis for Acsion
While the efficient markets hypothesis continues to be taught by some, it has been proven that markets are over-reactive dynamic systems, and investors are not always rational. One flawed but reasonable way to assess how sentiment around a company has changed is to compare the earnings per share (EPS) with the share price.
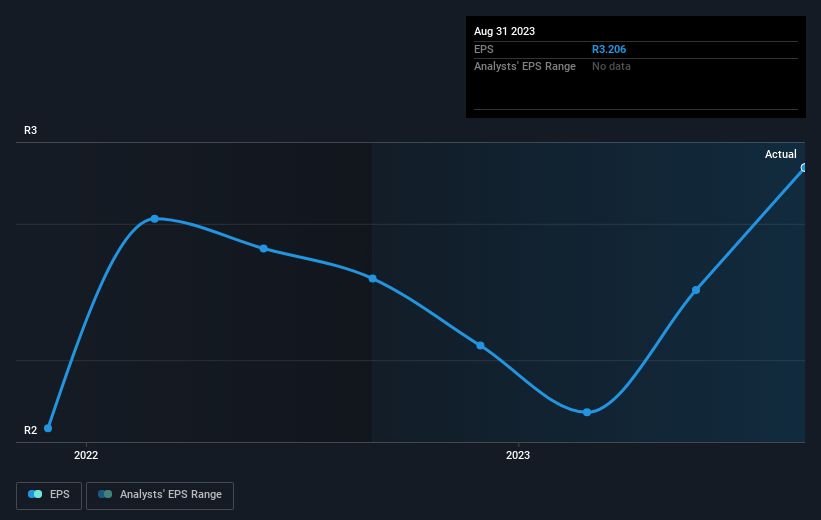
Acsion was able to grow its EPS at 49% per year over three years, sending the share price higher. This EPS growth is higher than the 9% average annual increase in the share price. So one could reasonably conclude that the market has cooled on the stock. We'd venture the lowish P/E ratio of 1.81 also reflects the negative sentiment around the stock.
The company's earnings per share (over time) is depicted in the image below (click to see the exact numbers).
It's good to see that there was some significant insider buying in the last three months. That's a positive. On the other hand, we think the revenue and earnings trends are much more meaningful measures of the business. Dive deeper into the earnings by checking this interactive graph of Acsion's earnings, revenue and cash flow.
What About Dividends?
It is important to consider the total shareholder return, as well as the share price return, for any given stock. Whereas the share price return only reflects the change in the share price, the TSR includes the value of dividends (assuming they were reinvested) and the benefit of any discounted capital raising or spin-off. It's fair to say that the TSR gives a more complete picture for stocks that pay a dividend. As it happens, Acsion's TSR for the last 3 years was 45%, which exceeds the share price return mentioned earlier. The dividends paid by the company have thusly boosted the total shareholder return.
A Different Perspective
We regret to report that Acsion shareholders are down 12% for the year (even including dividends). Unfortunately, that's worse than the broader market decline of 0.8%. However, it could simply be that the share price has been impacted by broader market jitters. It might be worth keeping an eye on the fundamentals, in case there's a good opportunity. On the bright side, long term shareholders have made money, with a gain of 1.6% per year over half a decade. It could be that the recent sell-off is an opportunity, so it may be worth checking the fundamental data for signs of a long term growth trend. I find it very interesting to look at share price over the long term as a proxy for business performance. But to truly gain insight, we need to consider other information, too. Like risks, for instance. Every company has them, and we've spotted 3 warning signs for Acsion (of which 1 doesn't sit too well with us!) you should know about.
There are plenty of other companies that have insiders buying up shares. You probably do not want to miss this free list of growing companies that insiders are buying.
Please note, the market returns quoted in this article reflect the market weighted average returns of stocks that currently trade on South African exchanges.
Valuation is complex, but we're helping make it simple.
Find out whether Acsion is potentially over or undervalued by checking out our comprehensive analysis, which includes fair value estimates, risks and warnings, dividends, insider transactions and financial health.
View the Free AnalysisHave feedback on this article? Concerned about the content? Get in touch with us directly. Alternatively, email editorial-team (at) simplywallst.com.
This article by Simply Wall St is general in nature. We provide commentary based on historical data and analyst forecasts only using an unbiased methodology and our articles are not intended to be financial advice. It does not constitute a recommendation to buy or sell any stock, and does not take account of your objectives, or your financial situation. We aim to bring you long-term focused analysis driven by fundamental data. Note that our analysis may not factor in the latest price-sensitive company announcements or qualitative material. Simply Wall St has no position in any stocks mentioned.
About JSE:ACS
Acsion
Acsion Limited engages in property holding and development activities in South Africa and internationally.
Good value with mediocre balance sheet.
