Stock Analysis
- South Africa
- /
- Chemicals
- /
- JSE:BCF
Bowler Metcalf Limited's (JSE:BCF) Stock Is Rallying But Financials Look Ambiguous: Will The Momentum Continue?

Most readers would already be aware that Bowler Metcalf's (JSE:BCF) stock increased significantly by 20% over the past three months. But the company's key financial indicators appear to be differing across the board and that makes us question whether or not the company's current share price momentum can be maintained. In this article, we decided to focus on Bowler Metcalf's ROE.
Return on equity or ROE is an important factor to be considered by a shareholder because it tells them how effectively their capital is being reinvested. In other words, it is a profitability ratio which measures the rate of return on the capital provided by the company's shareholders.
See our latest analysis for Bowler Metcalf
How Is ROE Calculated?
ROE can be calculated by using the formula:
Return on Equity = Net Profit (from continuing operations) ÷ Shareholders' Equity
So, based on the above formula, the ROE for Bowler Metcalf is:
9.4% = R69m ÷ R728m (Based on the trailing twelve months to June 2023).
The 'return' is the profit over the last twelve months. One way to conceptualize this is that for each ZAR1 of shareholders' capital it has, the company made ZAR0.09 in profit.
What Is The Relationship Between ROE And Earnings Growth?
We have already established that ROE serves as an efficient profit-generating gauge for a company's future earnings. We now need to evaluate how much profit the company reinvests or "retains" for future growth which then gives us an idea about the growth potential of the company. Assuming everything else remains unchanged, the higher the ROE and profit retention, the higher the growth rate of a company compared to companies that don't necessarily bear these characteristics.
Bowler Metcalf's Earnings Growth And 9.4% ROE
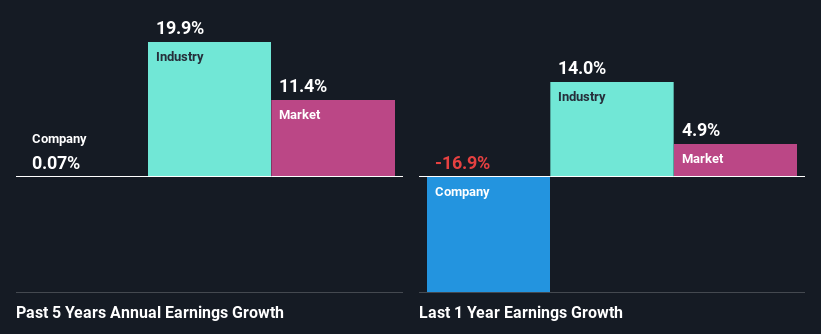
It is hard to argue that Bowler Metcalf's ROE is much good in and of itself. Even when compared to the industry average of 17%, the ROE figure is pretty disappointing. As a result, Bowler Metcalf's flat earnings over the past five years doesn't come as a surprise given its lower ROE.
We then compared Bowler Metcalf's net income growth with the industry and found that the company's growth figure is lower than the average industry growth rate of 20% in the same 5-year period, which is a bit concerning.
The basis for attaching value to a company is, to a great extent, tied to its earnings growth. It’s important for an investor to know whether the market has priced in the company's expected earnings growth (or decline). This then helps them determine if the stock is placed for a bright or bleak future. What is BCF worth today? The intrinsic value infographic in our free research report helps visualize whether BCF is currently mispriced by the market.
Is Bowler Metcalf Using Its Retained Earnings Effectively?
Despite having a normal three-year median payout ratio of 41% (implying that the company keeps 59% of its income) over the last three years, Bowler Metcalf has seen a negligible amount of growth in earnings as we saw above. So there could be some other explanation in that regard. For instance, the company's business may be deteriorating.
In addition, Bowler Metcalf has been paying dividends over a period of at least ten years suggesting that keeping up dividend payments is way more important to the management even if it comes at the cost of business growth.
Conclusion
In total, we're a bit ambivalent about Bowler Metcalf's performance. While the company does have a high rate of profit retention, its low rate of return is probably hampering its earnings growth. Up till now, we've only made a short study of the company's growth data. To gain further insights into Bowler Metcalf's past profit growth, check out this visualization of past earnings, revenue and cash flows.
Valuation is complex, but we're helping make it simple.
Find out whether Bowler Metcalf is potentially over or undervalued by checking out our comprehensive analysis, which includes fair value estimates, risks and warnings, dividends, insider transactions and financial health.
View the Free AnalysisHave feedback on this article? Concerned about the content? Get in touch with us directly. Alternatively, email editorial-team (at) simplywallst.com.
This article by Simply Wall St is general in nature. We provide commentary based on historical data and analyst forecasts only using an unbiased methodology and our articles are not intended to be financial advice. It does not constitute a recommendation to buy or sell any stock, and does not take account of your objectives, or your financial situation. We aim to bring you long-term focused analysis driven by fundamental data. Note that our analysis may not factor in the latest price-sensitive company announcements or qualitative material. Simply Wall St has no position in any stocks mentioned.
About JSE:BCF
Bowler Metcalf
Bowler Metcalf Limited manufactures and sells rigid plastic packaging for the toiletry, cosmetic, household, pharmaceutical, and food markets in South Africa.
Flawless balance sheet with proven track record and pays a dividend.

