Stock Analysis
- South Africa
- /
- Capital Markets
- /
- JSE:YYLBEE
YeboYethu (RF) (JSE:YYLBEE) rallies 11% this week, taking five-year gains to 2.5%

It's nice to see the YeboYethu (RF) Limited (JSE:YYLBEE) share price up 11% in a week. But that doesn't change the fact that the returns over the last five years have been less than pleasing. After all, the share price is down 25% in that time, significantly under-performing the market.
While the stock has risen 11% in the past week but long term shareholders are still in the red, let's see what the fundamentals can tell us.
See our latest analysis for YeboYethu (RF)
In his essay The Superinvestors of Graham-and-Doddsville Warren Buffett described how share prices do not always rationally reflect the value of a business. By comparing earnings per share (EPS) and share price changes over time, we can get a feel for how investor attitudes to a company have morphed over time.
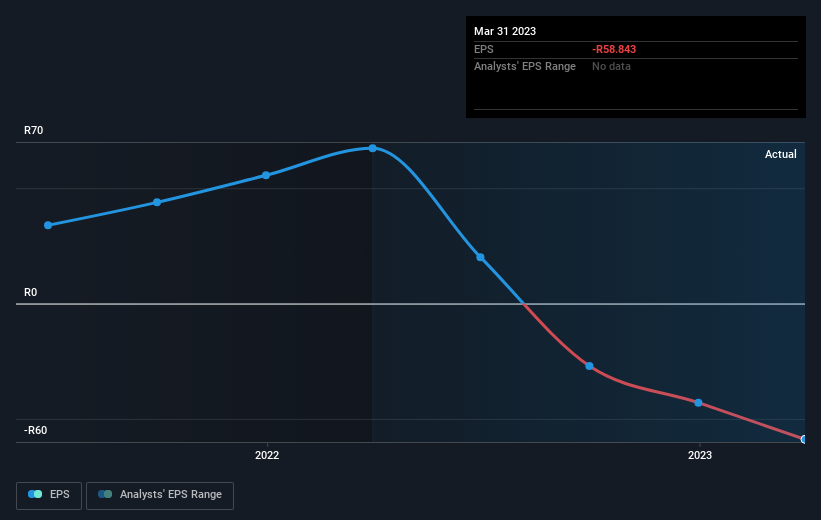
In the last half decade YeboYethu (RF) saw its share price fall as its EPS declined below zero. At present it's hard to make valid comparisons between EPS and the share price. But we would generally expect a lower price, given the situation.
The image below shows how EPS has tracked over time (if you click on the image you can see greater detail).
Before buying or selling a stock, we always recommend a close examination of historic growth trends, available here.
What About Dividends?
It is important to consider the total shareholder return, as well as the share price return, for any given stock. The TSR is a return calculation that accounts for the value of cash dividends (assuming that any dividend received was reinvested) and the calculated value of any discounted capital raisings and spin-offs. Arguably, the TSR gives a more comprehensive picture of the return generated by a stock. We note that for YeboYethu (RF) the TSR over the last 5 years was 2.5%, which is better than the share price return mentioned above. The dividends paid by the company have thusly boosted the total shareholder return.
A Different Perspective
While the broader market lost about 1.9% in the twelve months, YeboYethu (RF) shareholders did even worse, losing 20% (even including dividends). However, it could simply be that the share price has been impacted by broader market jitters. It might be worth keeping an eye on the fundamentals, in case there's a good opportunity. Longer term investors wouldn't be so upset, since they would have made 0.5%, each year, over five years. If the fundamental data continues to indicate long term sustainable growth, the current sell-off could be an opportunity worth considering. I find it very interesting to look at share price over the long term as a proxy for business performance. But to truly gain insight, we need to consider other information, too. Take risks, for example - YeboYethu (RF) has 4 warning signs (and 2 which don't sit too well with us) we think you should know about.
But note: YeboYethu (RF) may not be the best stock to buy. So take a peek at this free list of interesting companies with past earnings growth (and further growth forecast).
Please note, the market returns quoted in this article reflect the market weighted average returns of stocks that currently trade on South African exchanges.
Valuation is complex, but we're helping make it simple.
Find out whether YeboYethu (RF) is potentially over or undervalued by checking out our comprehensive analysis, which includes fair value estimates, risks and warnings, dividends, insider transactions and financial health.
View the Free AnalysisHave feedback on this article? Concerned about the content? Get in touch with us directly. Alternatively, email editorial-team (at) simplywallst.com.
This article by Simply Wall St is general in nature. We provide commentary based on historical data and analyst forecasts only using an unbiased methodology and our articles are not intended to be financial advice. It does not constitute a recommendation to buy or sell any stock, and does not take account of your objectives, or your financial situation. We aim to bring you long-term focused analysis driven by fundamental data. Note that our analysis may not factor in the latest price-sensitive company announcements or qualitative material. Simply Wall St has no position in any stocks mentioned.
About JSE:YYLBEE
YeboYethu (RF)
YeboYethu (RF) Limited engages in the business of acquiring and holding shares in Vodacom Group.
Good value unattractive dividend payer.

