- South Africa
- /
- Banks
- /
- JSE:SBK
Standard Bank Group's (JSE:SBK) investors will be pleased with their favorable 82% return over the last three years


By buying an index fund, investors can approximate the average market return. But if you choose individual stocks with prowess, you can make superior returns. Just take a look at Standard Bank Group Limited (JSE:SBK), which is up 51%, over three years, soundly beating the market return of 3.0% (not including dividends). On the other hand, the returns haven't been quite so good recently, with shareholders up just 22% , including dividends .
Now it's worth having a look at the company's fundamentals too, because that will help us determine if the long term shareholder return has matched the performance of the underlying business.
Check out our latest analysis for Standard Bank Group
There is no denying that markets are sometimes efficient, but prices do not always reflect underlying business performance. One flawed but reasonable way to assess how sentiment around a company has changed is to compare the earnings per share (EPS) with the share price.
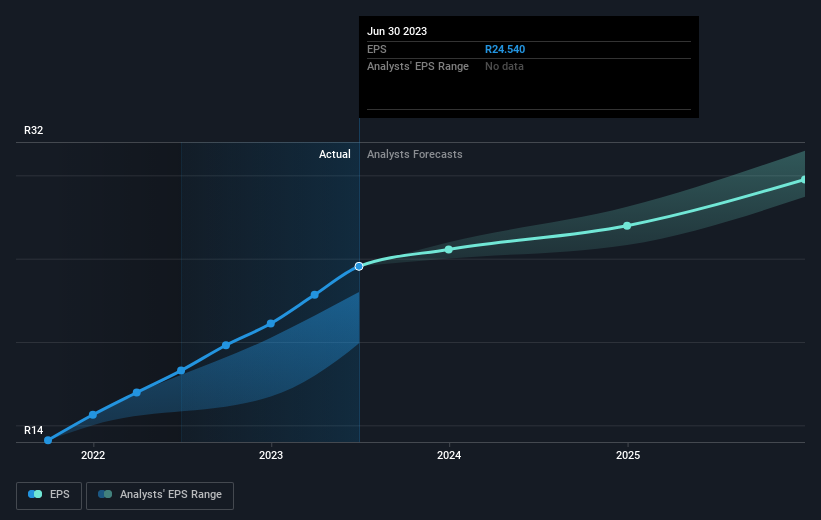
Standard Bank Group was able to grow its EPS at 34% per year over three years, sending the share price higher. This EPS growth is higher than the 15% average annual increase in the share price. Therefore, it seems the market has moderated its expectations for growth, somewhat. This cautious sentiment is reflected in its (fairly low) P/E ratio of 8.45.
You can see below how EPS has changed over time (discover the exact values by clicking on the image).
It is of course excellent to see how Standard Bank Group has grown profits over the years, but the future is more important for shareholders. You can see how its balance sheet has strengthened (or weakened) over time in this free interactive graphic.
What About Dividends?
As well as measuring the share price return, investors should also consider the total shareholder return (TSR). Whereas the share price return only reflects the change in the share price, the TSR includes the value of dividends (assuming they were reinvested) and the benefit of any discounted capital raising or spin-off. So for companies that pay a generous dividend, the TSR is often a lot higher than the share price return. We note that for Standard Bank Group the TSR over the last 3 years was 82%, which is better than the share price return mentioned above. This is largely a result of its dividend payments!
A Different Perspective
It's good to see that Standard Bank Group has rewarded shareholders with a total shareholder return of 22% in the last twelve months. Of course, that includes the dividend. That gain is better than the annual TSR over five years, which is 8%. Therefore it seems like sentiment around the company has been positive lately. Someone with an optimistic perspective could view the recent improvement in TSR as indicating that the business itself is getting better with time. It's always interesting to track share price performance over the longer term. But to understand Standard Bank Group better, we need to consider many other factors. For example, we've discovered 1 warning sign for Standard Bank Group that you should be aware of before investing here.
But note: Standard Bank Group may not be the best stock to buy. So take a peek at this free list of interesting companies with past earnings growth (and further growth forecast).
Please note, the market returns quoted in this article reflect the market weighted average returns of stocks that currently trade on South African exchanges.
New: Manage All Your Stock Portfolios in One Place
We've created the ultimate portfolio companion for stock investors, and it's free.
• Connect an unlimited number of Portfolios and see your total in one currency
• Be alerted to new Warning Signs or Risks via email or mobile
• Track the Fair Value of your stocks
Have feedback on this article? Concerned about the content? Get in touch with us directly. Alternatively, email editorial-team (at) simplywallst.com.
This article by Simply Wall St is general in nature. We provide commentary based on historical data and analyst forecasts only using an unbiased methodology and our articles are not intended to be financial advice. It does not constitute a recommendation to buy or sell any stock, and does not take account of your objectives, or your financial situation. We aim to bring you long-term focused analysis driven by fundamental data. Note that our analysis may not factor in the latest price-sensitive company announcements or qualitative material. Simply Wall St has no position in any stocks mentioned.
About JSE:SBK
Standard Bank Group
Provides banking and financial products and services in South Africa and internationally.
Proven track record with adequate balance sheet and pays a dividend.

