Stock Analysis
- United States
- /
- Other Utilities
- /
- NYSE:SRE
Is Sempra's (NYSE:SRE) Latest Stock Performance Being Led By Its Strong Fundamentals?


Sempra's (NYSE:SRE) stock is up by 2.9% over the past week. Given its impressive performance, we decided to study the company's key financial indicators as a company's long-term fundamentals usually dictate market outcomes. In this article, we decided to focus on Sempra's ROE.
Return on Equity or ROE is a test of how effectively a company is growing its value and managing investors’ money. In short, ROE shows the profit each dollar generates with respect to its shareholder investments.
Check out our latest analysis for Sempra
How Do You Calculate Return On Equity?
Return on equity can be calculated by using the formula:
Return on Equity = Net Profit (from continuing operations) ÷ Shareholders' Equity
So, based on the above formula, the ROE for Sempra is:
11% = US$3.6b ÷ US$34b (Based on the trailing twelve months to December 2023).
The 'return' is the profit over the last twelve months. So, this means that for every $1 of its shareholder's investments, the company generates a profit of $0.11.
What Has ROE Got To Do With Earnings Growth?
We have already established that ROE serves as an efficient profit-generating gauge for a company's future earnings. Based on how much of its profits the company chooses to reinvest or "retain", we are then able to evaluate a company's future ability to generate profits. Generally speaking, other things being equal, firms with a high return on equity and profit retention, have a higher growth rate than firms that don’t share these attributes.
Sempra's Earnings Growth And 11% ROE
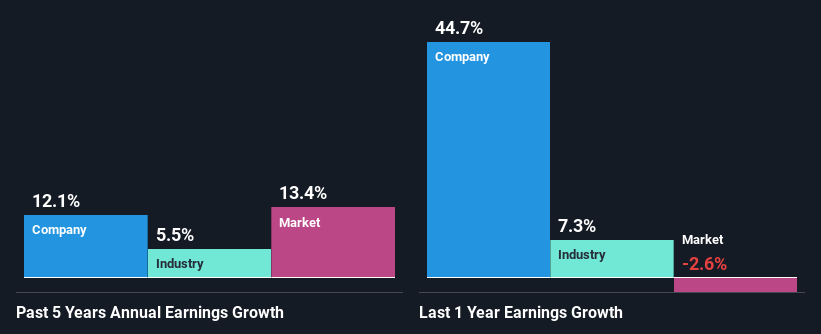
At first glance, Sempra seems to have a decent ROE. Further, the company's ROE is similar to the industry average of 9.5%. This certainly adds some context to Sempra's moderate 12% net income growth seen over the past five years.
Next, on comparing with the industry net income growth, we found that Sempra's growth is quite high when compared to the industry average growth of 5.5% in the same period, which is great to see.
Earnings growth is an important metric to consider when valuing a stock. It’s important for an investor to know whether the market has priced in the company's expected earnings growth (or decline). By doing so, they will have an idea if the stock is headed into clear blue waters or if swampy waters await. Has the market priced in the future outlook for SRE? You can find out in our latest intrinsic value infographic research report.
Is Sempra Efficiently Re-investing Its Profits?
The high three-year median payout ratio of 64% (or a retention ratio of 36%) for Sempra suggests that the company's growth wasn't really hampered despite it returning most of its income to its shareholders.
Moreover, Sempra is determined to keep sharing its profits with shareholders which we infer from its long history of paying a dividend for at least ten years. Our latest analyst data shows that the future payout ratio of the company over the next three years is expected to be approximately 51%. Therefore, the company's future ROE is also not expected to change by much with analysts predicting an ROE of 11%.
Summary
On the whole, we feel that Sempra's performance has been quite good. Especially the high ROE, Which has contributed to the impressive growth seen in earnings. Despite the company reinvesting only a small portion of its profits, it still has managed to grow its earnings so that is appreciable. With that said, the latest industry analyst forecasts reveal that the company's earnings growth is expected to slow down. Are these analysts expectations based on the broad expectations for the industry, or on the company's fundamentals? Click here to be taken to our analyst's forecasts page for the company.
Valuation is complex, but we're helping make it simple.
Find out whether Sempra is potentially over or undervalued by checking out our comprehensive analysis, which includes fair value estimates, risks and warnings, dividends, insider transactions and financial health.
View the Free AnalysisHave feedback on this article? Concerned about the content? Get in touch with us directly. Alternatively, email editorial-team (at) simplywallst.com.
This article by Simply Wall St is general in nature. We provide commentary based on historical data and analyst forecasts only using an unbiased methodology and our articles are not intended to be financial advice. It does not constitute a recommendation to buy or sell any stock, and does not take account of your objectives, or your financial situation. We aim to bring you long-term focused analysis driven by fundamental data. Note that our analysis may not factor in the latest price-sensitive company announcements or qualitative material. Simply Wall St has no position in any stocks mentioned.
About NYSE:SRE
Sempra
Sempra operates as an energy infrastructure company in the United States and internationally.
Undervalued with solid track record and pays a dividend.
