Stock Analysis
- United States
- /
- Wireless Telecom
- /
- NasdaqGS:TIGO
The five-year shareholder returns and company earnings persist lower as Millicom International Cellular (NASDAQ:TIGO) stock falls a further 4.1% in past week

We think intelligent long term investing is the way to go. But unfortunately, some companies simply don't succeed. For example the Millicom International Cellular S.A. (NASDAQ:TIGO) share price dropped 74% over five years. That's not a lot of fun for true believers. And it's not just long term holders hurting, because the stock is down 21% in the last year. Unfortunately the share price momentum is still quite negative, with prices down 17% in thirty days.
With the stock having lost 4.1% in the past week, it's worth taking a look at business performance and seeing if there's any red flags.
View our latest analysis for Millicom International Cellular
While markets are a powerful pricing mechanism, share prices reflect investor sentiment, not just underlying business performance. One way to examine how market sentiment has changed over time is to look at the interaction between a company's share price and its earnings per share (EPS).
Millicom International Cellular became profitable within the last five years. Most would consider that to be a good thing, so it's counter-intuitive to see the share price declining. Other metrics might give us a better handle on how its value is changing over time.
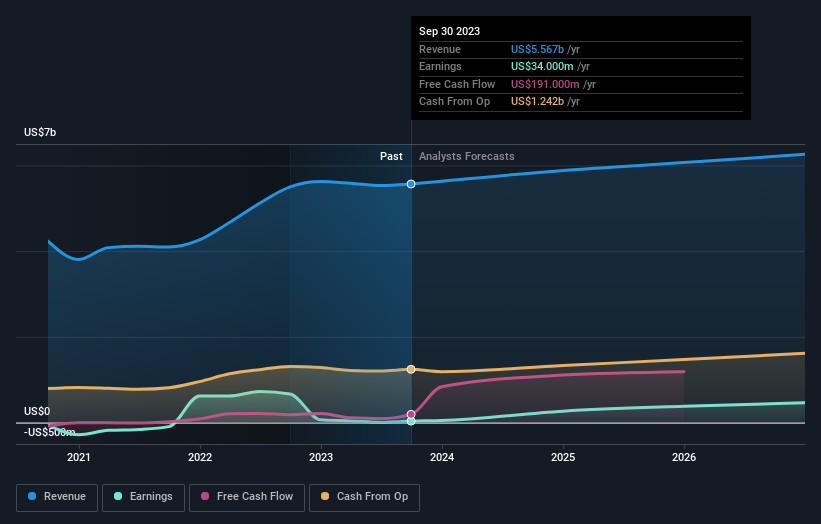
Revenue is actually up 7.6% over the time period. A more detailed examination of the revenue and earnings may or may not explain why the share price languishes; there could be an opportunity.
The graphic below depicts how earnings and revenue have changed over time (unveil the exact values by clicking on the image).
We know that Millicom International Cellular has improved its bottom line over the last three years, but what does the future have in store? This free interactive report on Millicom International Cellular's balance sheet strength is a great place to start, if you want to investigate the stock further.
What About The Total Shareholder Return (TSR)?
We'd be remiss not to mention the difference between Millicom International Cellular's total shareholder return (TSR) and its share price return. The TSR is a return calculation that accounts for the value of cash dividends (assuming that any dividend received was reinvested) and the calculated value of any discounted capital raisings and spin-offs. Its history of dividend payouts mean that Millicom International Cellular's TSR, which was a 65% drop over the last 5 years, was not as bad as the share price return.
A Different Perspective
Millicom International Cellular shareholders are down 21% for the year, but the market itself is up 19%. Even the share prices of good stocks drop sometimes, but we want to see improvements in the fundamental metrics of a business, before getting too interested. Regrettably, last year's performance caps off a bad run, with the shareholders facing a total loss of 11% per year over five years. Generally speaking long term share price weakness can be a bad sign, though contrarian investors might want to research the stock in hope of a turnaround. While it is well worth considering the different impacts that market conditions can have on the share price, there are other factors that are even more important. For instance, we've identified 2 warning signs for Millicom International Cellular (1 is a bit concerning) that you should be aware of.
Of course Millicom International Cellular may not be the best stock to buy. So you may wish to see this free collection of growth stocks.
Please note, the market returns quoted in this article reflect the market weighted average returns of stocks that currently trade on American exchanges.
Valuation is complex, but we're helping make it simple.
Find out whether Millicom International Cellular is potentially over or undervalued by checking out our comprehensive analysis, which includes fair value estimates, risks and warnings, dividends, insider transactions and financial health.
View the Free AnalysisHave feedback on this article? Concerned about the content? Get in touch with us directly. Alternatively, email editorial-team (at) simplywallst.com.
This article by Simply Wall St is general in nature. We provide commentary based on historical data and analyst forecasts only using an unbiased methodology and our articles are not intended to be financial advice. It does not constitute a recommendation to buy or sell any stock, and does not take account of your objectives, or your financial situation. We aim to bring you long-term focused analysis driven by fundamental data. Note that our analysis may not factor in the latest price-sensitive company announcements or qualitative material. Simply Wall St has no position in any stocks mentioned.
About NasdaqGS:TIGO
Millicom International Cellular
Millicom International Cellular S.A. provides cable and mobile services in Latin America.
Fair value with moderate growth potential.

