Advertisement
- United States
- /
- Electronic Equipment and Components
- /
- NasdaqGS:PLUS
Is It Time To Revisit ePlus (PLUS) After Recent Share Price Pullback

Reviewed by Bailey Pemberton
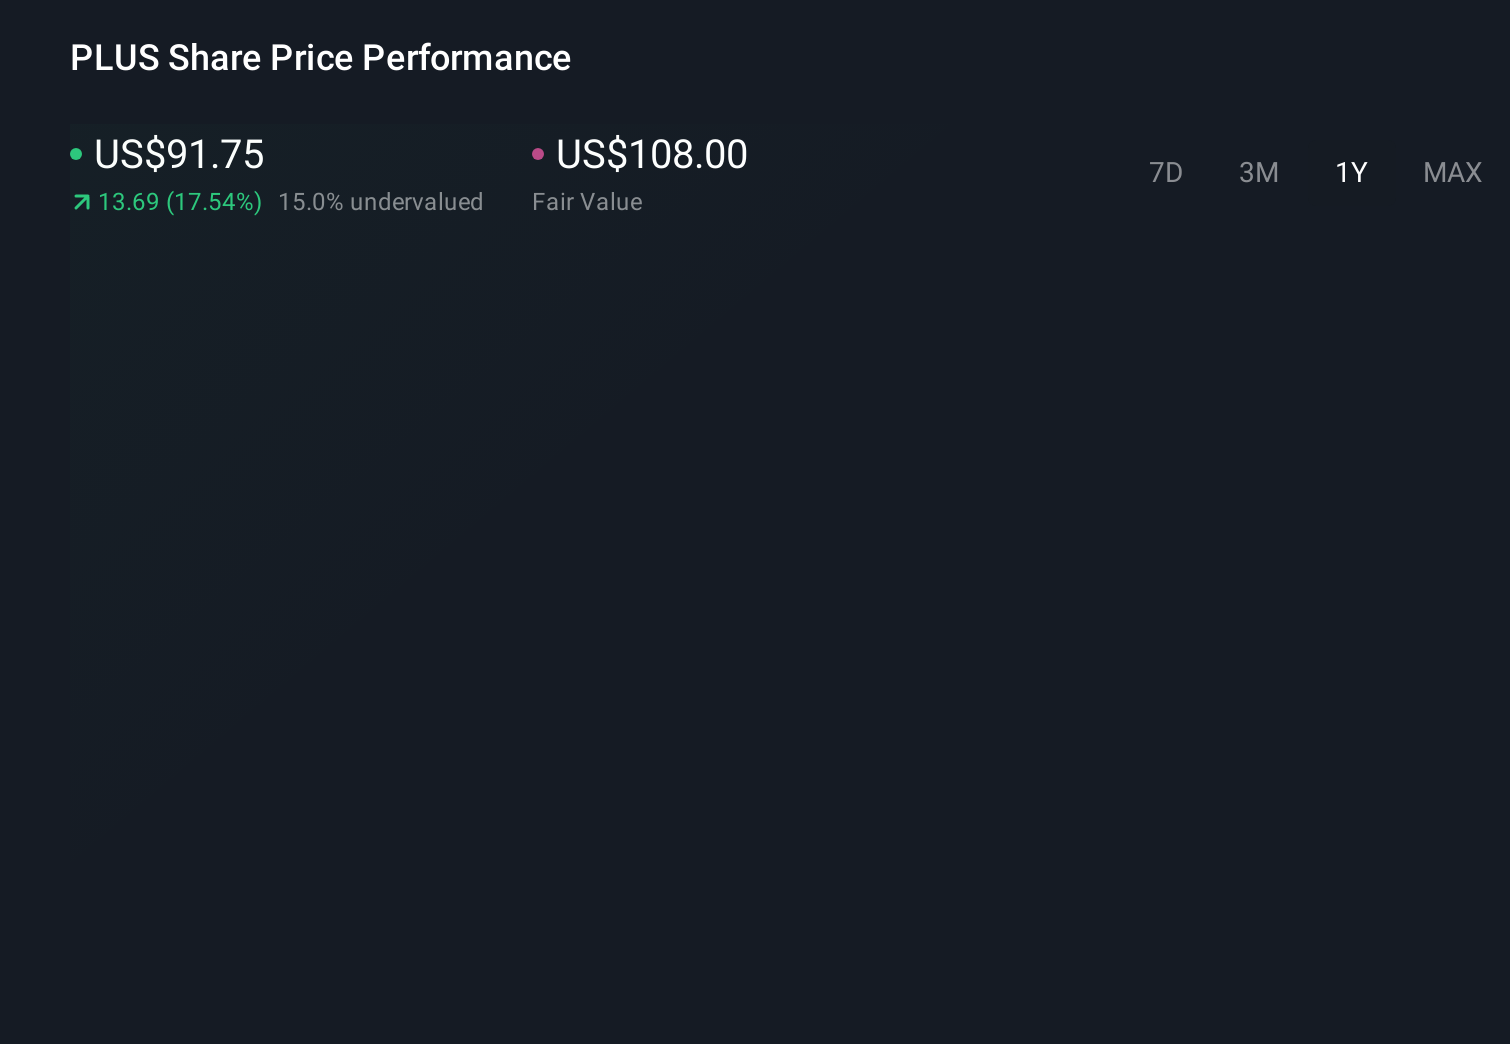
- If you are wondering whether ePlus at around US$83.88 is offering fair value or hiding a margin of safety, you are not alone.
- The stock has seen short term pullbacks, with a 3.4% decline over the last 7 days and 4.3% over the last 30 days, while still sitting on a 20.0% return over 1 year and 88.4% over 5 years.
- These mixed returns have kept interest alive in how the market is currently sizing up ePlus, as investors weigh its recent share price softness against its longer term record. This article was created to provide ongoing, evergreen coverage of the company so you have a clear and up to date view of what that pricing might reflect.
- ePlus currently scores 5 out of 6 on our valuation checks, giving it a valuation score of 5. Next we will walk through the key valuation approaches behind that number, before finishing with a framework that can help you make more sense of where value truly sits.
Find out why ePlus's 20.0% return over the last year is lagging behind its peers.
Approach 1: ePlus Discounted Cash Flow (DCF) Analysis
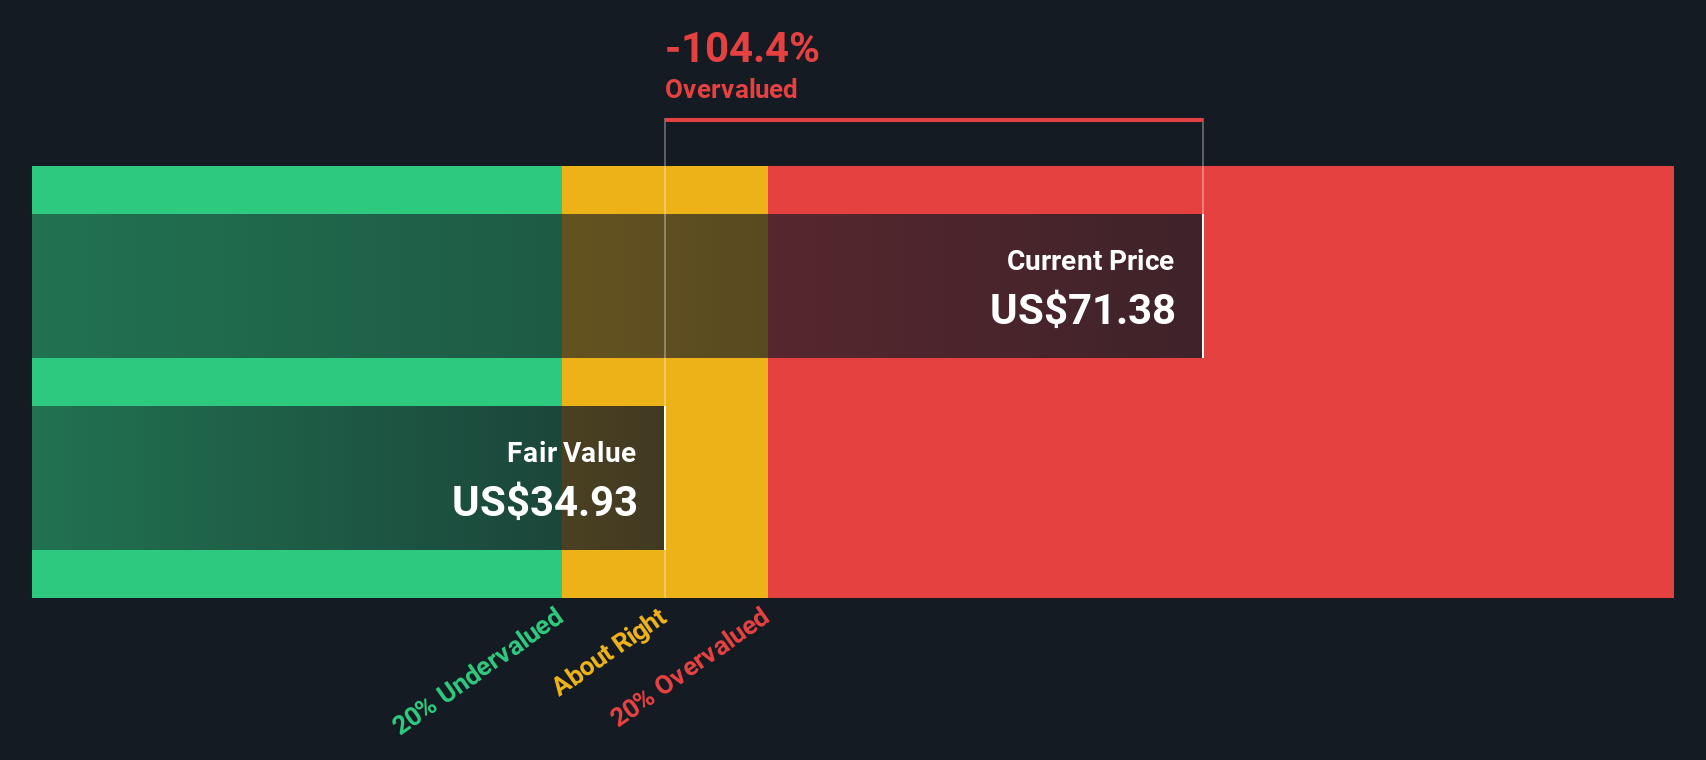
A Discounted Cash Flow model takes estimates of a company’s future cash flows and then discounts them back to today’s dollars to arrive at an implied value per share.
For ePlus, the model used is a 2 Stage Free Cash Flow to Equity approach. On a last twelve months basis, free cash flow is reported as a loss of about $68.2 million. Looking ahead, the projections used in the model show free cash flow moving to $151.7 million by the year ending March 2028, with further annual figures out to 2035 based on a mix of analyst input and extrapolations.
Bringing all those future cash flows back to today and dividing by the shares outstanding gives an estimated intrinsic value of about $124.41 per share. Compared with the recent share price of roughly $83.88, this suggests the stock is around 32.6% undervalued according to this DCF output.
Result: UNDERVALUED
Our Discounted Cash Flow (DCF) analysis suggests ePlus is undervalued by 32.6%. Track this in your watchlist or portfolio, or discover 53 more high quality undervalued stocks.
Approach 2: ePlus Price vs Earnings
For a profitable business like ePlus, the P/E ratio is a useful way to see what you are paying for each dollar of earnings. It keeps the focus on the bottom line, which ultimately supports dividends, buybacks and reinvestment.
What counts as a “normal” P/E really comes down to what investors expect from a company’s future growth and how risky they think those earnings are. Higher growth or lower perceived risk can justify a higher multiple, while slower growth or higher risk usually calls for a lower one.
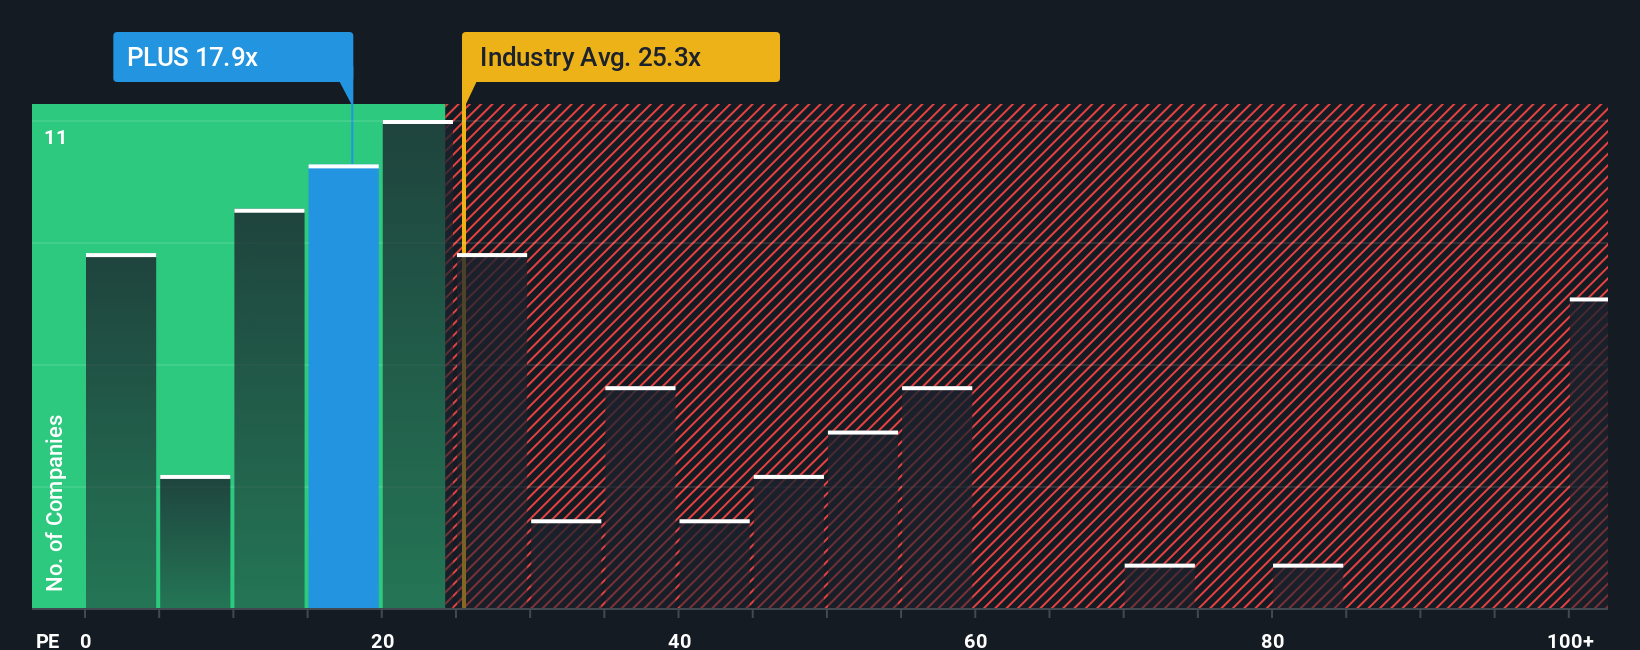
ePlus currently trades on a P/E of 14.81x. That sits below the Electronic industry average of 28.31x and also below the peer group average of 19.87x. Simply Wall St’s “Fair Ratio” for ePlus is 20.30x. This is a proprietary estimate of what the P/E might be given factors like its earnings growth profile, industry, profit margins, market value and company specific risks.
Because the Fair Ratio blends these company specific drivers, it can be more tailored than a simple comparison with broad industry or peer averages. Lining up the Fair Ratio of 20.30x against the current 14.81x suggests the shares are trading below that fair multiple.
Result: UNDERVALUED
P/E ratios tell one story, but what if the real opportunity lies elsewhere? Start investing in legacies, not executives. Discover our 23 top founder-led companies.
Upgrade Your Decision Making: Choose your ePlus Narrative
Earlier we mentioned that there is an even better way to understand valuation, so let us introduce you to Narratives, a simple tool on Simply Wall St's Community page that lets you connect your view of ePlus's story to a clear set of revenue, earnings and margin forecasts. These then roll up into a fair value you can compare to the current share price. They update automatically as new news or earnings arrive, and can even differ meaningfully from other investors. For example, someone who accepts the consensus fair value of US$108 and a future P/E of 28.85x can compare their view to a more cautious Narrative that leans on lower margins or slower revenue growth and therefore lands on a lower fair value. This helps each investor decide whether the gap between their fair value and the market price looks attractive or stretched.
Do you think there's more to the story for ePlus? Head over to our Community to see what others are saying!
This article by Simply Wall St is general in nature. We provide commentary based on historical data and analyst forecasts only using an unbiased methodology and our articles are not intended to be financial advice. It does not constitute a recommendation to buy or sell any stock, and does not take account of your objectives, or your financial situation. We aim to bring you long-term focused analysis driven by fundamental data. Note that our analysis may not factor in the latest price-sensitive company announcements or qualitative material. Simply Wall St has no position in any stocks mentioned.
New: Manage All Your Stock Portfolios in One Place
We've created the ultimate portfolio companion for stock investors, and it's free.
• Connect an unlimited number of Portfolios and see your total in one currency
• Be alerted to new Warning Signs or Risks via email or mobile
• Track the Fair Value of your stocks
Have feedback on this article? Concerned about the content? Get in touch with us directly. Alternatively, email editorial-team@simplywallst.com
About NasdaqGS:PLUS
ePlus
Provides information technology (IT) solutions that enable organizations to optimize IT environment and supply chain processes in the United States and internationally.
Excellent balance sheet with proven track record.
Similar Companies
Market Insights


Advertisement
Weekly Picks
LO


Lou_Basenese on Cue Biopharma ·
Cue Biopharma (NASDAQ: CUE): The Scientist Behind Xolair Just Gave Cue a Next-Generation Shot at the Same Multi-Billion-Dollar Market
Fair Value:US$7060.2% undervalued
29 followersusers have followed this narrative
0 commentsusers have commented on this narrative
6 likesusers have liked this narrative
HA


HarishPK on Adobe ·
Adobe: A Probabilistic Case for Undervaluation
Fair Value:US$317.226.4% undervalued
35 followersusers have followed this narrative
7 commentsusers have commented on this narrative
13 likesusers have liked this narrative
NI


niteco on Broadcom ·
A Capital Allocation Favorite with Structural Importance
Fair Value:US$651.0542.8% undervalued
38 followersusers have followed this narrative
0 commentsusers have commented on this narrative
8 likesusers have liked this narrative
TO


Tokyo on Okta ·
Good foundation, but now it's all about the next steps
Fair Value:US$15123.9% undervalued
86 followersusers have followed this narrative
7 commentsusers have commented on this narrative
11 likesusers have liked this narrative
Recently Updated Narratives
RO


RockeTeller on Guanajuato Silver ·
Guanajuanto Silver, Hidden Gem of 1.8M Oz Producer + 75,000m Drilling = Huge Upside
Fair Value:CA$9.8495.2% undervalued
13 followersusers have followed this narrative
2 commentsusers have commented on this narrative
0 likesusers have liked this narrative
AS


AstrisCorporateAdvisory on Polaris Holdings ·
Share gains to fuel earnings momentum
Fair Value:JP¥211.1621.9% undervalued
1 followerusers have followed this narrative
0 commentsusers have commented on this narrative
0 likesusers have liked this narrative
WI

Wizkhalifa on PSP Energy Berhad ·
PSP Energy Breaks Key Downtrend, Momentum Building for Further Upside
Fair Value:RM 0.09257.6% overvalued
1 followerusers have followed this narrative
0 commentsusers have commented on this narrative
0 likesusers have liked this narrative
Popular Narratives
MA


martinarauz on Nu Holdings ·
Investment Analysis (May 2026)
Fair Value:US$22.7448.9% undervalued
60 followersusers have followed this narrative
0 commentsusers have commented on this narrative
15 likesusers have liked this narrative
CL


Clive_Thompson on Take-Two Interactive Software ·
Take-Two Interactive: The Calm Before the Storm NASDAQ: TTWO Last Price: $242.41 Date: May 15, 2026
Fair Value:US$276.9724.0% undervalued
58 followersusers have followed this narrative
0 commentsusers have commented on this narrative
14 likesusers have liked this narrative
NI

niteco on Honeywell International ·
Honeywell - The Demand-Side of the AI Infrastructure
Fair Value:US$320.1935.7% undervalued
48 followersusers have followed this narrative
0 commentsusers have commented on this narrative
19 likesusers have liked this narrative
Trending Discussion

SI

Simply Wall St User on Access Holdings ·
It's wonderful. It has greatly helped me take informed decisions.
1
|0