- United States
- /
- Semiconductors
- /
- NasdaqGS:VECO
Declining Stock and Solid Fundamentals: Is The Market Wrong About Veeco Instruments Inc. (NASDAQ:VECO)?


Veeco Instruments (NASDAQ:VECO) has had a rough three months with its share price down 28%. However, a closer look at its sound financials might cause you to think again. Given that fundamentals usually drive long-term market outcomes, the company is worth looking at. Specifically, we decided to study Veeco Instruments' ROE in this article.
Return on Equity or ROE is a test of how effectively a company is growing its value and managing investors’ money. In short, ROE shows the profit each dollar generates with respect to its shareholder investments.
Check out our latest analysis for Veeco Instruments
How Is ROE Calculated?
ROE can be calculated by using the formula:
Return on Equity = Net Profit (from continuing operations) ÷ Shareholders' Equity
So, based on the above formula, the ROE for Veeco Instruments is:
12% = US$83m ÷ US$715m (Based on the trailing twelve months to June 2024).
The 'return' is the income the business earned over the last year. That means that for every $1 worth of shareholders' equity, the company generated $0.12 in profit.
What Has ROE Got To Do With Earnings Growth?
So far, we've learned that ROE is a measure of a company's profitability. We now need to evaluate how much profit the company reinvests or "retains" for future growth which then gives us an idea about the growth potential of the company. Generally speaking, other things being equal, firms with a high return on equity and profit retention, have a higher growth rate than firms that don’t share these attributes.
A Side By Side comparison of Veeco Instruments' Earnings Growth And 12% ROE
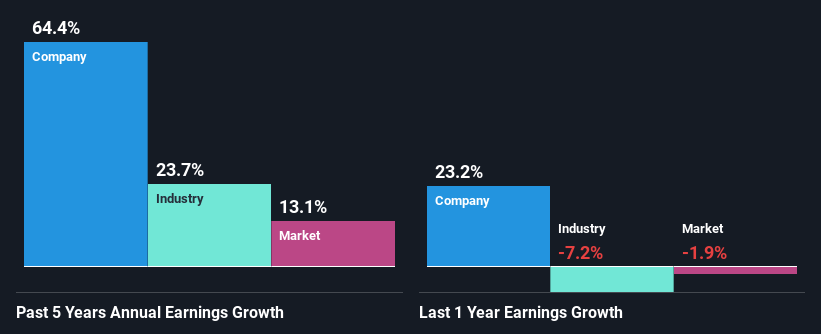
To start with, Veeco Instruments' ROE looks acceptable. Further, the company's ROE is similar to the industry average of 12%. This probably goes some way in explaining Veeco Instruments' significant 64% net income growth over the past five years amongst other factors. However, there could also be other drivers behind this growth. For instance, the company has a low payout ratio or is being managed efficiently.
Next, on comparing with the industry net income growth, we found that Veeco Instruments' growth is quite high when compared to the industry average growth of 24% in the same period, which is great to see.
Earnings growth is an important metric to consider when valuing a stock. The investor should try to establish if the expected growth or decline in earnings, whichever the case may be, is priced in. By doing so, they will have an idea if the stock is headed into clear blue waters or if swampy waters await. One good indicator of expected earnings growth is the P/E ratio which determines the price the market is willing to pay for a stock based on its earnings prospects. So, you may want to check if Veeco Instruments is trading on a high P/E or a low P/E, relative to its industry.
Is Veeco Instruments Efficiently Re-investing Its Profits?
Veeco Instruments doesn't pay any regular dividends to its shareholders, meaning that the company has been reinvesting all of its profits into the business. This is likely what's driving the high earnings growth number discussed above.
Summary
Overall, we are quite pleased with Veeco Instruments' performance. Particularly, we like that the company is reinvesting heavily into its business, and at a high rate of return. Unsurprisingly, this has led to an impressive earnings growth. That being so, a study of the latest analyst forecasts show that the company is expected to see a slowdown in its future earnings growth. Are these analysts expectations based on the broad expectations for the industry, or on the company's fundamentals? Click here to be taken to our analyst's forecasts page for the company.
New: Manage All Your Stock Portfolios in One Place
We've created the ultimate portfolio companion for stock investors, and it's free.
• Connect an unlimited number of Portfolios and see your total in one currency
• Be alerted to new Warning Signs or Risks via email or mobile
• Track the Fair Value of your stocks
Have feedback on this article? Concerned about the content? Get in touch with us directly. Alternatively, email editorial-team (at) simplywallst.com.
This article by Simply Wall St is general in nature. We provide commentary based on historical data and analyst forecasts only using an unbiased methodology and our articles are not intended to be financial advice. It does not constitute a recommendation to buy or sell any stock, and does not take account of your objectives, or your financial situation. We aim to bring you long-term focused analysis driven by fundamental data. Note that our analysis may not factor in the latest price-sensitive company announcements or qualitative material. Simply Wall St has no position in any stocks mentioned.
About NasdaqGS:VECO
Veeco Instruments
Develops, manufactures, sells, and supports semiconductor and thin film process equipment primarily to make electronic devices in the United States, Europe, the Middle East, and Africa, China, Rest of the Asia-Pacific, and internationally.
Excellent balance sheet with proven track record.
