Advertisement
- United States
- /
- Semiconductors
- /
- NasdaqGS:AMAT
Has Applied Materials’ 40% Surge in 2025 Made the Stock Too Pricey?

Simply Wall St
Reviewed by Bailey Pemberton
- Wondering if Applied Materials is a bargain, overpriced, or just right? You're not alone. With all the buzz in the semiconductor world, it's natural to be curious about where the value really lies.
- The stock has soared 40.4% year to date, dipped 3.2% over the last week, and delivered an impressive 222.9% return over five years. This is a reminder that expectations and risk perceptions can shift fast.
- Recent headlines have spotlighted Applied Materials' pivotal role in supplying chipmaking equipment, especially as global demand ramps up for advanced semiconductors. Policy updates on US-China tech trade and upbeat sector forecasts have also been key drivers behind recent volatility in the share price.
- When it comes to valuation, Applied Materials scores 3 out of 6 on our value checks (see the detailed scorecard), landing it in the middle ground. Next, we'll break down how analysts value the company, and at the end introduce a smarter way to judge if it's truly great value.
Find out why Applied Materials's 23.3% return over the last year is lagging behind its peers.
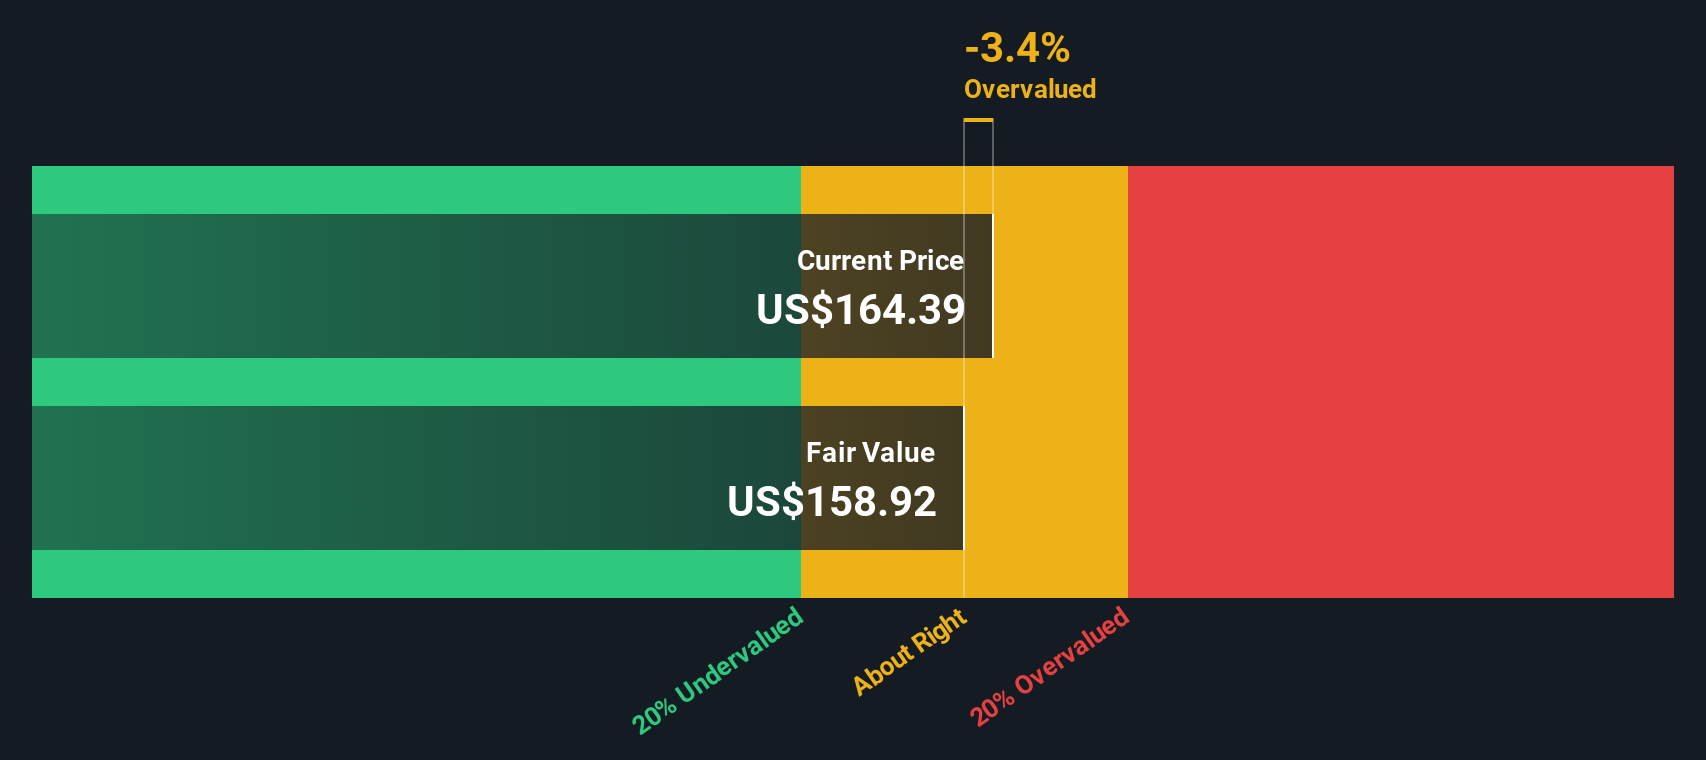
Approach 1: Applied Materials Discounted Cash Flow (DCF) Analysis
The Discounted Cash Flow (DCF) model estimates a company's true worth by projecting its future cash flows and discounting them back to today's value. This method aims to determine what a company is fundamentally worth based on how much cash it can generate over time.
For Applied Materials, the most recent reported Free Cash Flow is approximately $6.31 billion. Analysts provide detailed estimates for the next five years, projecting steady growth from $6.37 billion in 2026 to $9.51 billion by 2029. Beyond this period, further annual increases are extrapolated, reaching $12.96 billion by 2035 based on Simply Wall St projections.
Using these projections, the DCF model calculates an intrinsic value of $154.72 per share. However, this estimate suggests that Applied Materials stock is currently trading at a 48.7% premium, meaning it appears overvalued based on the company's expected future cash flows.
Result: OVERVALUED
Our Discounted Cash Flow (DCF) analysis suggests Applied Materials may be overvalued by 48.7%. Discover 872 undervalued stocks or create your own screener to find better value opportunities.
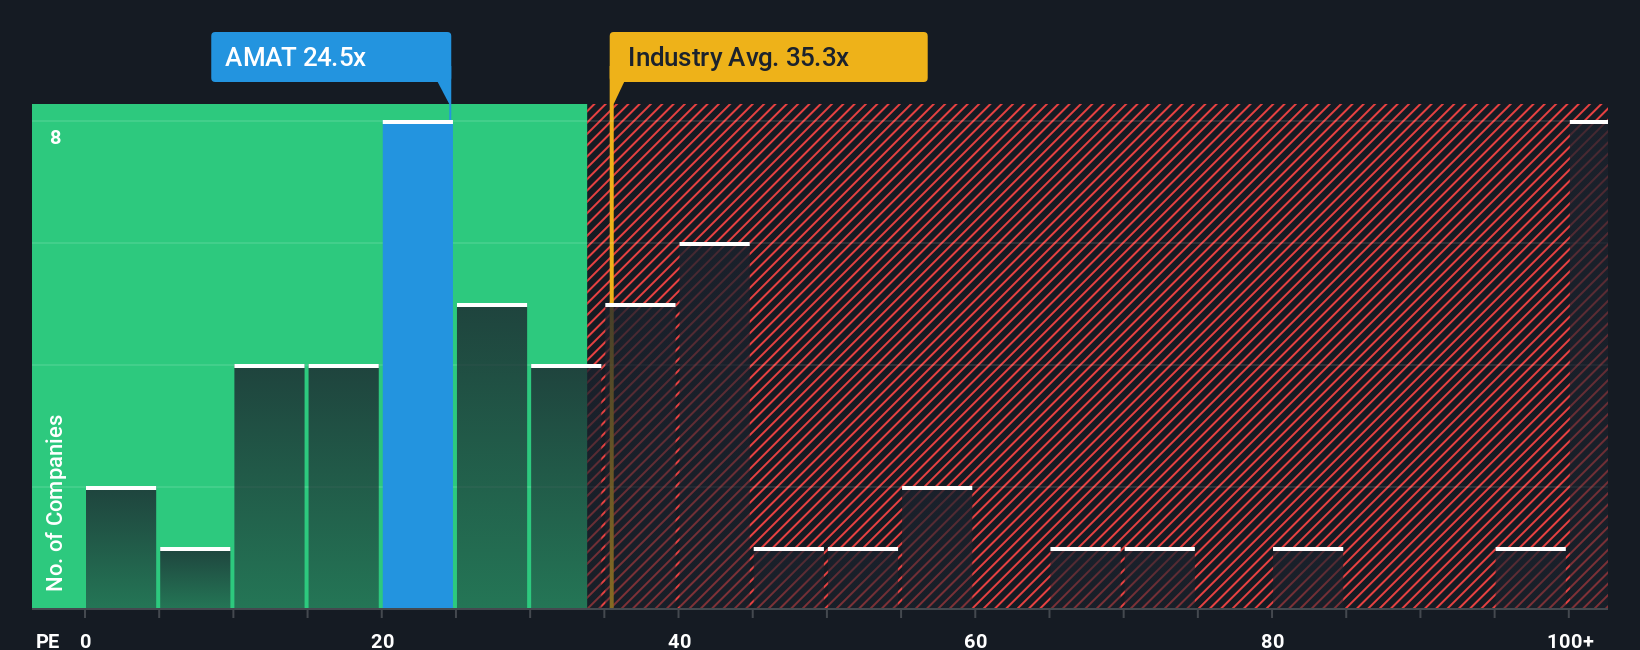
Approach 2: Applied Materials Price vs Earnings (PE)
The Price-to-Earnings (PE) ratio is often the go-to valuation metric for profitable companies like Applied Materials. This is because it directly relates a company’s share price to its per-share earnings, making it straightforward to gauge how much investors are willing to pay for each dollar of profit.
What counts as a “normal” PE ratio, though, depends on the market’s view of the company’s growth prospects and risk profile. Companies with strong growth or stable earnings tend to trade at higher PE ratios, while more uncertain or low-growth firms command lower ones.
Currently, Applied Materials trades at a PE ratio of 26.8x. This is lower than the Semiconductor industry average of 35.4x and also below its peer group average of 40.2x. At first glance, this suggests the stock is valued more conservatively than most of its competitors.
However, Simply Wall St also calculates a proprietary Fair Ratio, which considers not just peer comparables, but also Applied Materials’ earnings growth, profit margins, industry trends, market capitalization, and risk. This fair multiple for Applied Materials is 33.5x. Unlike basic peer or sector comparisons, the Fair Ratio offers a tailored benchmark that adapts to the company’s unique fundamentals and situation.
Comparing the current PE ratio (26.8x) to the Fair Ratio (33.5x), Applied Materials stock appears to be undervalued by this measure.
Result: UNDERVALUED
PE ratios tell one story, but what if the real opportunity lies elsewhere? Discover 1401 companies where insiders are betting big on explosive growth.
Upgrade Your Decision Making: Choose your Applied Materials Narrative
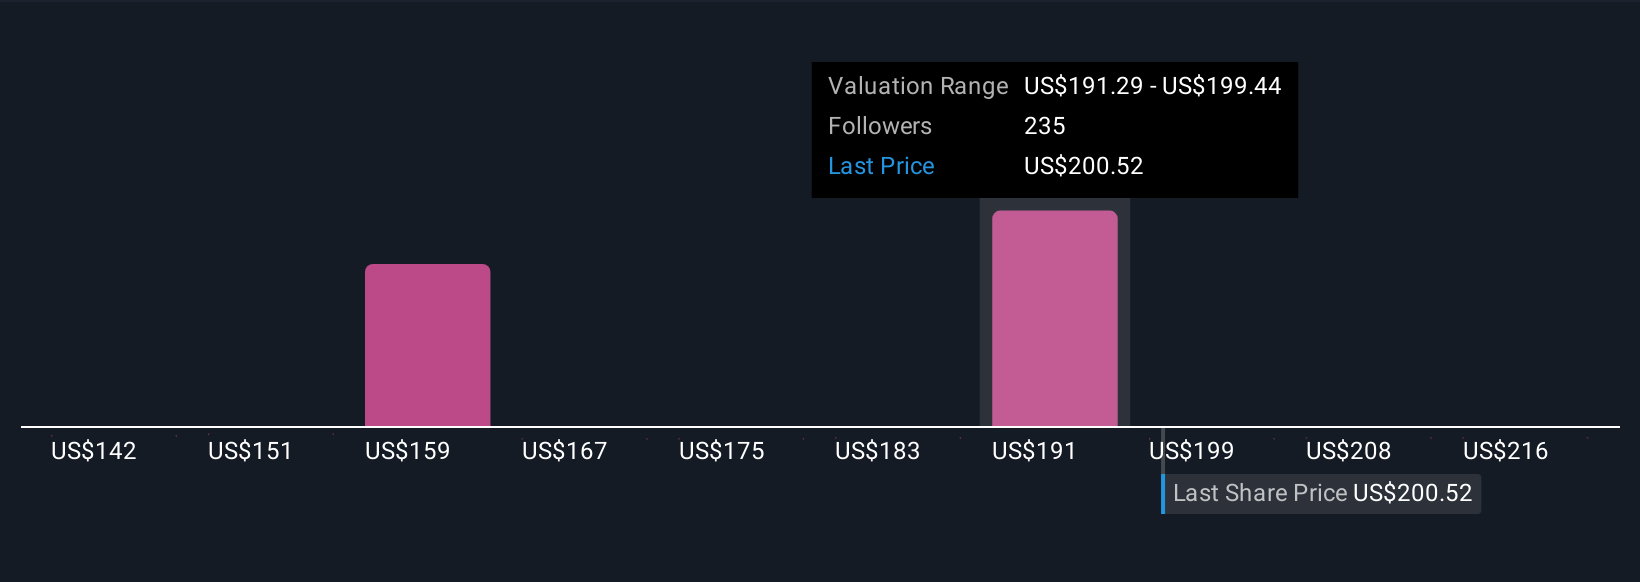
Earlier, we mentioned there is an even better way to understand valuation, so let’s introduce you to Narratives, a dynamic, accessible tool designed to put your own perspective at the center of every investment call.
A Narrative is simply the story behind the numbers, letting you combine your view on a company’s future with your assumptions about its fair value, revenue growth, earnings, and profit margins. Instead of relying solely on standard valuation ratios or analyst forecasts, a Narrative links what you believe about a company’s future to a tailored financial forecast, which is then used to estimate a fair value for the shares.
On Simply Wall St’s Community page, millions of investors use Narratives to model their outlook on Applied Materials and other companies. This helps them decide whether to buy or sell by comparing their own Fair Value estimate to the current share price. Narratives update automatically as new information is released, from earnings reports to breaking news, keeping your investment story fresh and actionable at all times.
For example, some investors see AI-driven chip demand and new packaging technologies sustaining a fair value as high as $240 per share. Others cite trade risks and industry cycles, landing as low as $160. This shows how Narratives capture each investor’s unique view.
Do you think there's more to the story for Applied Materials? Head over to our Community to see what others are saying!
This article by Simply Wall St is general in nature. We provide commentary based on historical data and analyst forecasts only using an unbiased methodology and our articles are not intended to be financial advice. It does not constitute a recommendation to buy or sell any stock, and does not take account of your objectives, or your financial situation. We aim to bring you long-term focused analysis driven by fundamental data. Note that our analysis may not factor in the latest price-sensitive company announcements or qualitative material. Simply Wall St has no position in any stocks mentioned.
New: Manage All Your Stock Portfolios in One Place
We've created the ultimate portfolio companion for stock investors, and it's free.
• Connect an unlimited number of Portfolios and see your total in one currency
• Be alerted to new Warning Signs or Risks via email or mobile
• Track the Fair Value of your stocks
Have feedback on this article? Concerned about the content? Get in touch with us directly. Alternatively, email editorial-team@simplywallst.com
About NasdaqGS:AMAT
Applied Materials
Engages in the provision of manufacturing equipment, services, and software to the semiconductor, display, and related industries.
Flawless balance sheet average dividend payer.
Similar Companies
Market Insights

Advertisement
Community Narratives
The "Molecular Pencil": Why Beam's Technology is Built to Win
Fair Value US$65.01|65.8% undervalued
DA
Community Contributor
The silent giant behind virtually every advanced chip powering AI, smartphones, and modern infrastructure.
Fair Value US$310.00|7.6% undervalued
OS
Community Contributor
ADP Stock: Solid Fundamentals, But AI Investments Test Its Margin Resilience
Fair Value US$387.77|34.5% undervalued
YI
Community Contributor