Advertisement
- United States
- /
- Semiconductors
- /
- NasdaqGS:ACLS
Axcelis Technologies (ACLS): Assessing Valuation After Third Quarter Revenue and Earnings Decline
Axcelis Technologies (ACLS) just released its third quarter results, and both revenue and net income have dropped compared to last year. The company also shared its guidance for the next quarter, highlighting ongoing challenges.
See our latest analysis for Axcelis Technologies.
The latest results come after a year of lumpy share price action for Axcelis Technologies, with the stock currently trading at $85.74. Despite recent quarterly dips in revenue and profit, short-term momentum has picked up, highlighted by a 22% year-to-date share price return. However, the one-year total shareholder return remains just under 1%. Over longer horizons, the three-year and five-year total returns of 11% and 230% reinforce that Axcelis still has long-term growth credentials. The pace of gains has clearly slowed this year.
If you’re monitoring semiconductors for your watchlist, it’s a great moment to discover See the full list for free.
Given weakening earnings and cautious forward guidance, the question becomes whether Axcelis Technologies is trading below its true value at these levels, or if the current price already reflects future challenges and opportunities.
Most Popular Narrative: 11.6% Undervalued
The most widely followed narrative points to a fair value of $97 per share, which is notably higher than Axcelis Technologies' last close at $85.74. This pricing gap has sparked renewed attention on the company, as the consensus view sees incremental value potential over where the stock trades today.
Ongoing R&D investments and next-generation Purion platform enhancements are driving increased customer engagement, particularly around advanced node processes (trench and super junction devices), enabling Axcelis to win share in premium market segments and supporting future gross margin improvement.
What if the next phase of growth is already priced in, or not at all? The story hinges on bold revenue and margin assumptions, plus a surprisingly high future profit multiple. Don’t miss the unusual scenarios shaping this $97 fair value. Dig into the details that just might defy conventional logic.
Result: Fair Value of $97 (UNDERVALUED)
Have a read of the narrative in full and understand what's behind the forecasts.
However, heavy reliance on Chinese customers and limited adoption of advanced technologies could quickly shift the outlook if demand trends unexpectedly weaken.
Find out about the key risks to this Axcelis Technologies narrative.
Another View: What Do Market Multiples Tell Us?
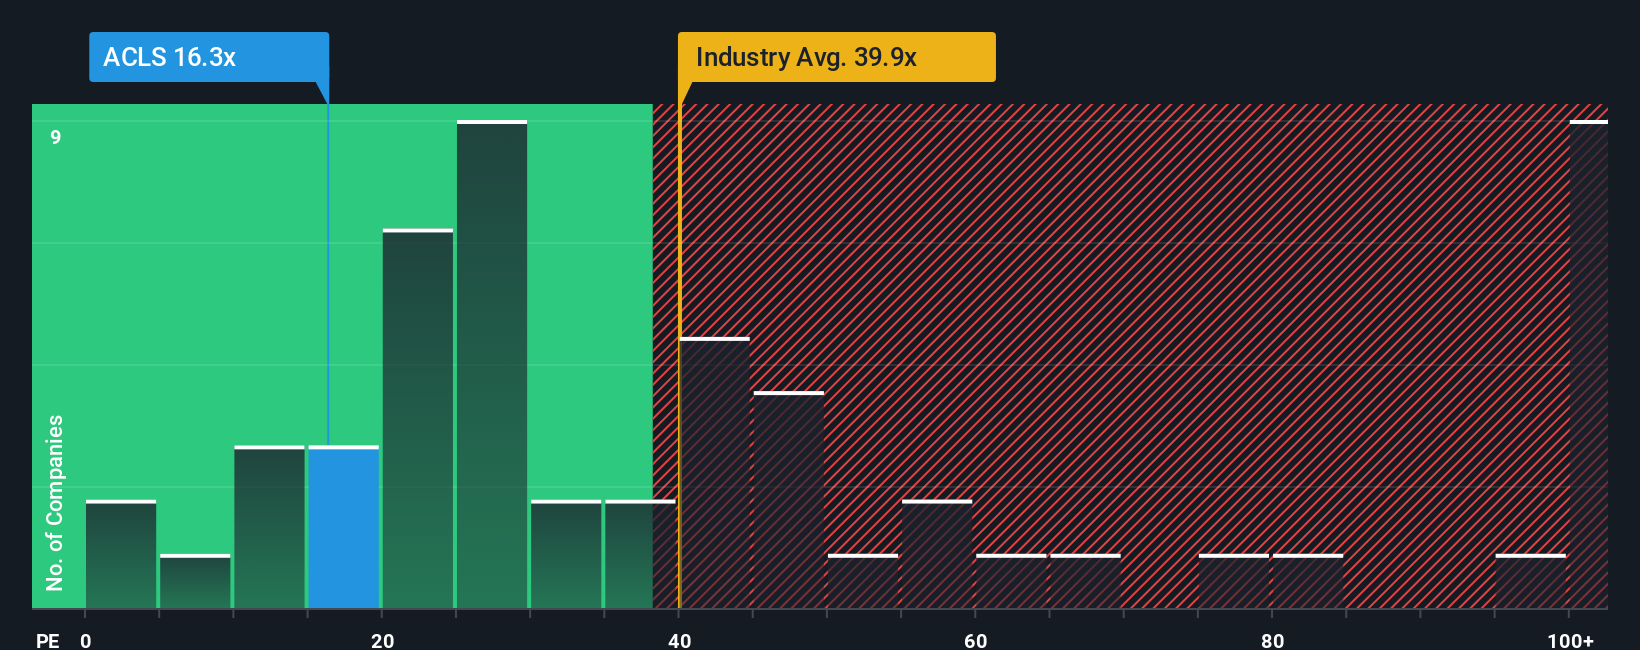
Taking a step back from the fair value analysis, Axcelis Technologies trades with a price-to-earnings ratio of 19.6x. This is much lower than the semiconductor industry’s average of 35.4x and below its peer group average of 41.3x. However, compared to our calculated fair ratio of 15.1x, Axcelis looks somewhat expensive relative to its fundamentals. This disconnect raises another question: is the market right to assign a premium, or is there hidden risk in the current price?
See what the numbers say about this price — find out in our valuation breakdown.
Build Your Own Axcelis Technologies Narrative
If the consensus view doesn't quite fit your outlook, why not check the data yourself and piece together your own version of the story in just a few minutes. Do it your way
A great starting point for your Axcelis Technologies research is our analysis highlighting 1 key reward and 1 important warning sign that could impact your investment decision.
Looking for More Smart Investment Opportunities?
Why limit yourself to just one promising stock when so many potential winners are right at your fingertips? Let these ideas spark your next move.
- Unlock steady income streams by sizing up these 16 dividend stocks with yields > 3% offering yields above 3% and robust payout histories worth your attention.
- Seize the future of artificial intelligence by checking out these 25 AI penny stocks making waves in automation, machine learning, and tomorrow’s innovations.
- Take advantage of distinctive value by zeroing in on these 874 undervalued stocks based on cash flows that may be flying under most investors’ radar.
This article by Simply Wall St is general in nature. We provide commentary based on historical data and analyst forecasts only using an unbiased methodology and our articles are not intended to be financial advice. It does not constitute a recommendation to buy or sell any stock, and does not take account of your objectives, or your financial situation. We aim to bring you long-term focused analysis driven by fundamental data. Note that our analysis may not factor in the latest price-sensitive company announcements or qualitative material. Simply Wall St has no position in any stocks mentioned.
New: Manage All Your Stock Portfolios in One Place
We've created the ultimate portfolio companion for stock investors, and it's free.
• Connect an unlimited number of Portfolios and see your total in one currency
• Be alerted to new Warning Signs or Risks via email or mobile
• Track the Fair Value of your stocks
Have feedback on this article? Concerned about the content? Get in touch with us directly. Alternatively, email editorial-team@simplywallst.com
About NasdaqGS:ACLS
Axcelis Technologies
Designs, manufactures, and services ion implantation and other processing equipment used in the fabrication of semiconductor chips in the United States, Europe, and the Asia Pacific.
Flawless balance sheet and slightly overvalued.
Similar Companies
Market Insights


Advertisement
Weekly Picks
CE


Ceazar on Sparc Al ·
When GPS fails: this small cap is fixing a $54B drone problem
Fair Value:CA$5.251.3% overvalued
17 followersusers have followed this narrative
0 commentsusers have commented on this narrative
4 likesusers have liked this narrative
SO

sorkdhkddlek on Marvell Technology ·
From AI Infrastructure Plumber to Full-Stack AI Factory Architect
Fair Value:US$14018.0% overvalued
14 followersusers have followed this narrative
0 commentsusers have commented on this narrative
5 likesusers have liked this narrative
MI


MiningStockAnalyst on Aurelia Metals ·
Aurelia Metals Limited — Transitioning Into a Higher-Quality Mid-Tier Producer
Fair Value:AU$0.427.5% undervalued
9 followersusers have followed this narrative
0 commentsusers have commented on this narrative
5 likesusers have liked this narrative
CO


composite32 on TotalEnergies ·
Is This strategic transformation of TTE? Significant re-rating potential
Fair Value:€88.2910.2% undervalued
16 followersusers have followed this narrative
2 commentsusers have commented on this narrative
3 likesusers have liked this narrative
Recently Updated Narratives
JA


Janpeo on Stellantis ·
IA Analysis
Fair Value:€1143.5% undervalued
3 followersusers have followed this narrative
0 commentsusers have commented on this narrative
0 likesusers have liked this narrative
AS


Asrikk on NVIDIA ·
Sustainable Dominance: Justifying a $270 Fair Value
Fair Value:US$27026.1% undervalued
1 followerusers have followed this narrative
0 commentsusers have commented on this narrative
0 likesusers have liked this narrative
MR


MRT23 on CorMedix ·
CRMD is trading at 5.9x trough-year EBITDA with the market ascribing near-zero value to two near-term pipeline events
Fair Value:US$1237.7% undervalued
5 followersusers have followed this narrative
0 commentsusers have commented on this narrative
0 likesusers have liked this narrative
Popular Narratives
KI
Kingman1152 on NVIDIA ·
NVIDIA will see a profit margin surge of 55% in the next 5 years
Fair Value:US$305.234.6% undervalued
68 followersusers have followed this narrative
2 commentsusers have commented on this narrative
24 likesusers have liked this narrative
TR


tripledub on Microsoft ·
Everyone's Terrified Microsoft Will Keep Spending. I'm Terrified They'll Stop.
Fair Value:US$3953.2% overvalued
55 followersusers have followed this narrative
3 commentsusers have commented on this narrative
43 likesusers have liked this narrative
AN

AnalystConsensusTarget on Microsoft ·
Analyst Commentary Highlights Microsoft AI Momentum and Upward Valuation Amid Growth and Competitive Risks
Fair Value:US$579.5729.6% undervalued
1392 followersusers have followed this narrative
2 commentsusers have commented on this narrative
11 likesusers have liked this narrative


