Advertisement
- United States
- /
- Specialty Stores
- /
- NYSE:AEO
Evaluating American Eagle After Aerie Expansion and 24% Price Surge in 2025

Simply Wall St
Reviewed by Bailey Pemberton
- Ever wondered if American Eagle Outfitters is actually a bargain, or if its recent buzz is just noise? Let’s walk through what the numbers and trends are saying about the stock’s real value.
- The stock has seen some solid moves recently, jumping 7.6% over the past week and gaining a notable 24.2% over the last month. This may have caught your attention whether you focus on short-term swings or long-term growth.
- This momentum has coincided with headlines about American Eagle’s ongoing efforts to expand its Aerie brand and its recent collaboration with a popular influencer campaign. Both have helped put the company back in the fashion spotlight. Investors have taken notice, driving demand and possibly reshaping how the market views risk for this retailer.
- Based on our six-point valuation framework, American Eagle Outfitters scores a 3 out of 6 for being undervalued, so there are reasons to look deeper. We will break down what those checks mean, and then reveal an even smarter way to understand the true value of this stock at the end of this article.
Find out why American Eagle Outfitters's 1.6% return over the last year is lagging behind its peers.
Approach 1: American Eagle Outfitters Discounted Cash Flow (DCF) Analysis
A Discounted Cash Flow (DCF) analysis estimates a company’s intrinsic value by projecting its future cash flows and discounting them back to today’s dollars. This helps investors determine if a stock is trading above or below its true worth.
For American Eagle Outfitters, the DCF model uses a 2 Stage Free Cash Flow to Equity approach. The company’s most recent annual free cash flow stands at $188.2 million. Looking ahead, analysts forecast a drop to $157 million by 2028. Beyond the official estimates, additional projections extend over the next ten years and estimate that free cash flow will fluctuate, eventually reaching around $145 million in 2035 according to long-term models by Simply Wall St.
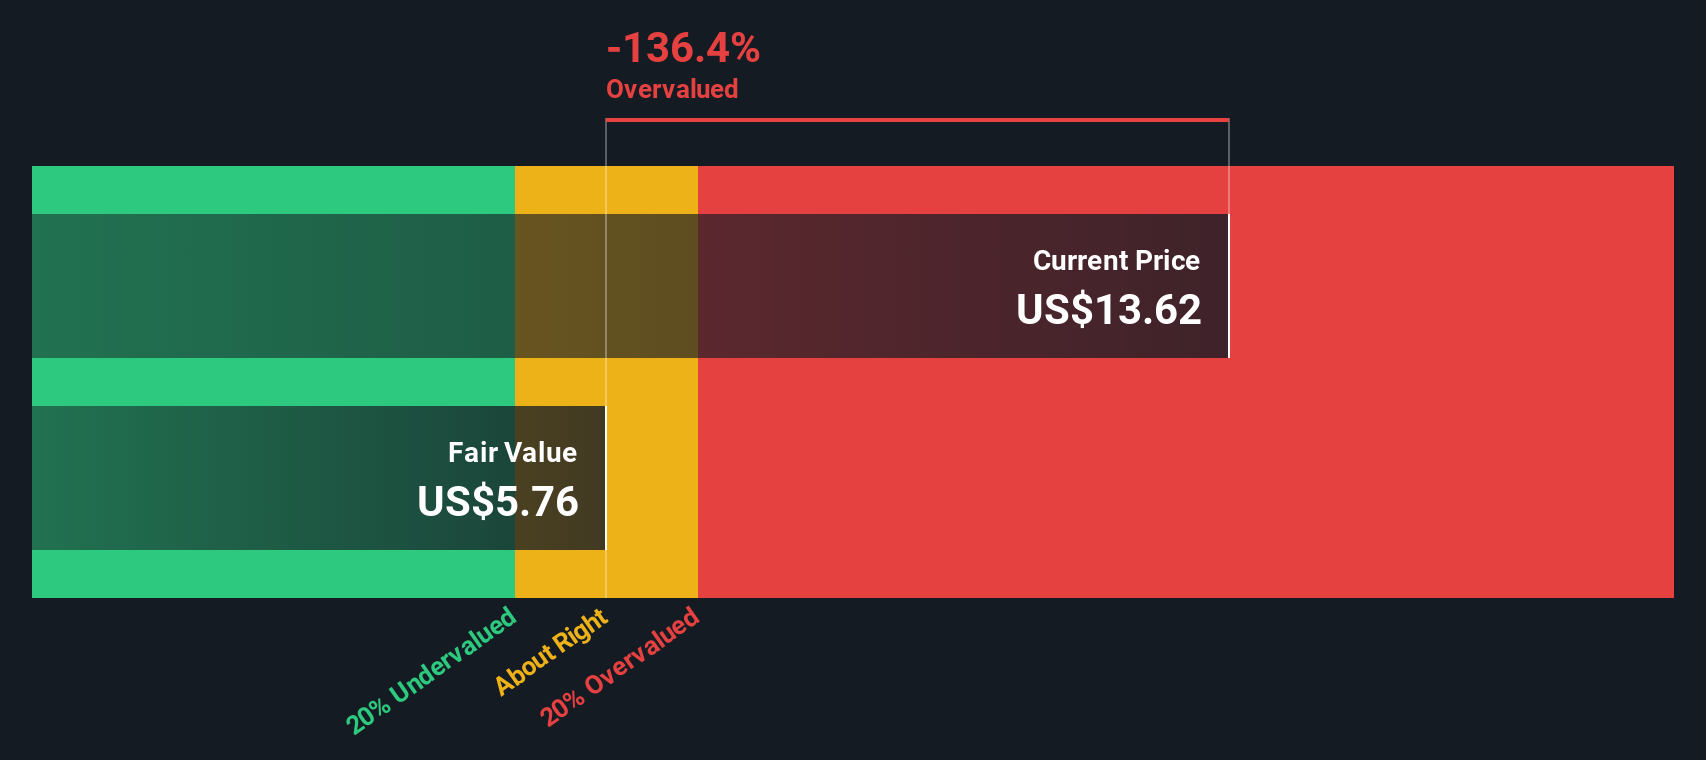
Based on these cash flow forecasts and by discounting them to present value, the DCF model calculates an estimated intrinsic value of $10.79 per share. When compared to the current market price, this figure implies that American Eagle Outfitters stock is about 64.8% overvalued.
Result: OVERVALUED
Our Discounted Cash Flow (DCF) analysis suggests American Eagle Outfitters may be overvalued by 64.8%. Discover 868 undervalued stocks or create your own screener to find better value opportunities.
Approach 2: American Eagle Outfitters Price vs Earnings
For profitable companies like American Eagle Outfitters, the Price-to-Earnings (PE) ratio is a common and effective way to assess valuation. The PE ratio tells investors how much they're paying for each dollar of earnings and is especially meaningful when a company generates consistent profits.
Growth expectations and company risk play a big part in what a “normal” or “fair” PE ratio should be. Companies with higher growth potential or lower risk often deserve a higher PE, while slower-growing or riskier businesses usually trade at lower multiples.
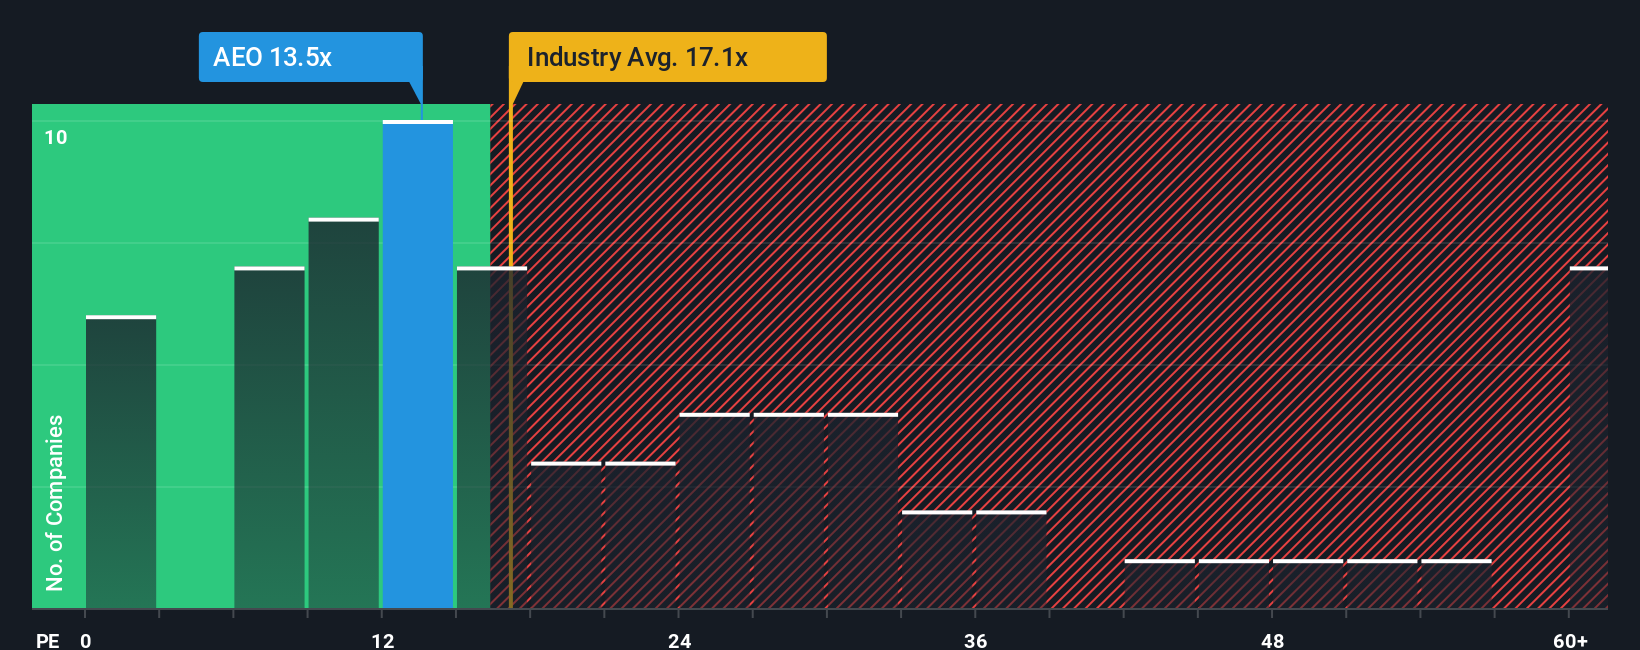
American Eagle Outfitters currently trades at a PE ratio of 15.3x. To put this in context, the average PE for similar specialty retailers is 18.4x, and peer companies' stocks change hands at about 17.0x earnings. At first glance, this suggests American Eagle is trading at a slight discount compared to both its industry and peer group.
However, Simply Wall St’s proprietary “Fair Ratio” goes beyond basic comparisons. It calculates what an appropriate multiple should be by considering the company’s expected earnings growth, profitability, market risks, industry dynamics, and even company size. This makes it a more reliable guide than just comparing American Eagle to peers or the broader industry.
The Fair PE Ratio for American Eagle Outfitters is 22.2x, which is well above its current 15.3x. This deeper look suggests that the stock is undervalued based on its earnings power and outlook, rather than just by comparison alone.
Result: UNDERVALUED
PE ratios tell one story, but what if the real opportunity lies elsewhere? Discover 1402 companies where insiders are betting big on explosive growth.
Upgrade Your Decision Making: Choose your American Eagle Outfitters Narrative
Earlier we mentioned that there's an even better way to understand valuation, so let's introduce you to Narratives. A Narrative is your personal story about a company. It goes beyond the numbers, combining your perspective and assumptions about American Eagle Outfitters’ future revenue, profit margins, and fair value into one logical forecast and valuation. Narratives make investing more accessible by connecting what you believe about a business, like a shift to digital sales or a new product launch, directly to financial outcomes.
On Simply Wall St’s Community page, millions of investors use Narratives to lay out their thinking, quickly see a company’s fair value based on their forecast, and compare it with today’s price to help highlight when to buy or sell. Narratives automatically update as news or earnings are released, so your perspective (and estimated value) always reflects the latest developments.
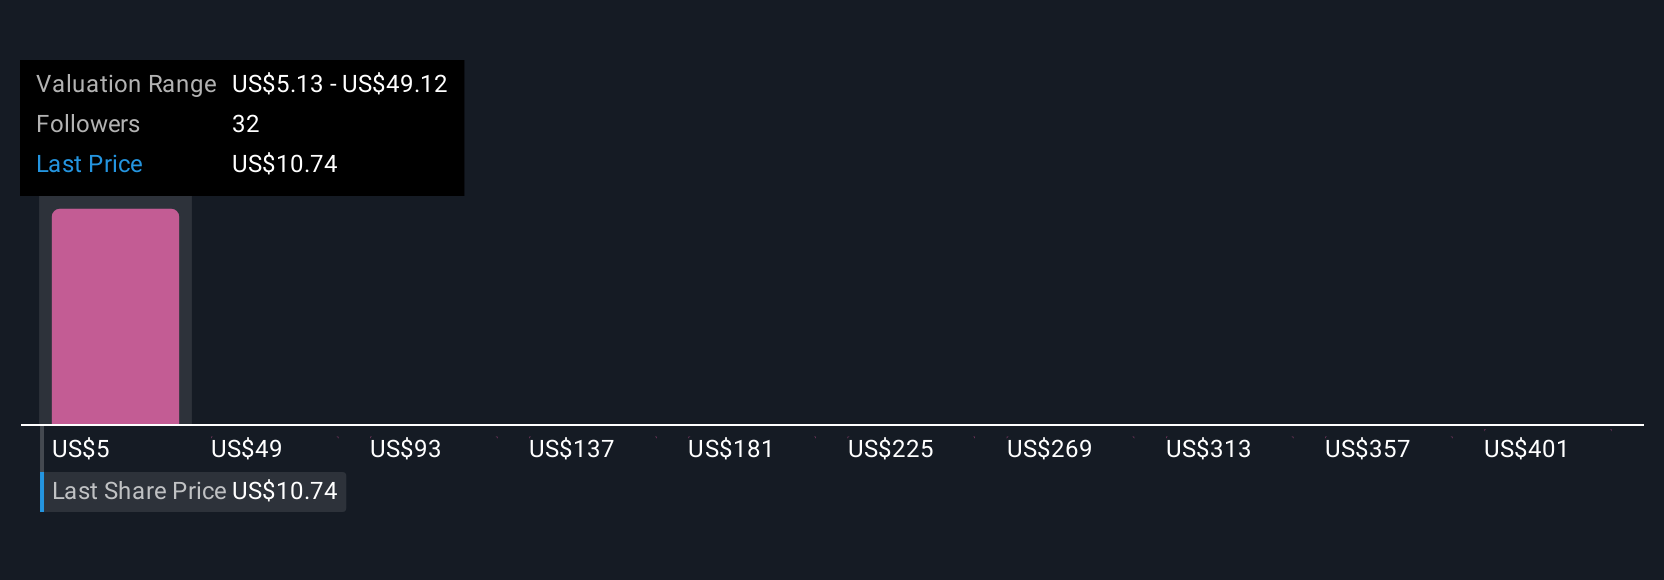
With American Eagle Outfitters, for example, some investors think revenue will climb and margins will expand, supporting a fair value as high as $21.50 per share. Others see tougher times ahead and set their fair value closer to $10.00. Your Narrative helps you decide which story you believe and how to act on it.
Do you think there's more to the story for American Eagle Outfitters? Head over to our Community to see what others are saying!
This article by Simply Wall St is general in nature. We provide commentary based on historical data and analyst forecasts only using an unbiased methodology and our articles are not intended to be financial advice. It does not constitute a recommendation to buy or sell any stock, and does not take account of your objectives, or your financial situation. We aim to bring you long-term focused analysis driven by fundamental data. Note that our analysis may not factor in the latest price-sensitive company announcements or qualitative material. Simply Wall St has no position in any stocks mentioned.
New: Manage All Your Stock Portfolios in One Place
We've created the ultimate portfolio companion for stock investors, and it's free.
• Connect an unlimited number of Portfolios and see your total in one currency
• Be alerted to new Warning Signs or Risks via email or mobile
• Track the Fair Value of your stocks
Have feedback on this article? Concerned about the content? Get in touch with us directly. Alternatively, email editorial-team@simplywallst.com
About NYSE:AEO
American Eagle Outfitters
Operates as a multi-brand specialty retailer in the United States and internationally.
Excellent balance sheet and fair value.
Similar Companies
Market Insights

Advertisement
Community Narratives
The "Molecular Pencil": Why Beam's Technology is Built to Win
Fair Value US$65.01|65.8% undervalued
DA
Community Contributor
The silent giant behind virtually every advanced chip powering AI, smartphones, and modern infrastructure.
Fair Value US$310.00|7.6% undervalued
OS
Community Contributor
ADP Stock: Solid Fundamentals, But AI Investments Test Its Margin Resilience
Fair Value US$387.77|34.5% undervalued
YI
Community Contributor