Advertisement
- United States
- /
- Industrial REITs
- /
- NYSE:TRNO
Terreno Realty (TRNO): Evaluating Valuation as Stronger Financials and New Leases Drive Operational Momentum

Simply Wall St
Reviewed by Simply Wall St
Terreno Realty (TRNO) just released its third quarter report, showing marked gains in revenue and net income along with several fresh long-term leases. These updates offer investors a direct look at operational progress and stability.
See our latest analysis for Terreno Realty.
Terreno Realty’s share price showed clear momentum recently, climbing 9.3% over the past month and advancing 13.3% in the latest quarter, as the company inked major new leases and affirmed another dividend. On a longer timeline, the stock’s total return stands at 1.9% for the past year and 16.1% over three years. This reflects steady, if unspectacular, growth that matches its operational stability and ability to navigate tenant turnover.
If you’re interested in seeing what else is trending across the market lately, now’s a great time to widen your search and discover fast growing stocks with high insider ownership
After this run of better earnings, dividend stability, and new leases, is Terreno Realty’s recent share price rally signaling a real bargain, or has the market already factored in all the future growth?
Price-to-Earnings of 19.8x: Is it justified?
Terreno Realty trades at a price-to-earnings (P/E) ratio of 19.8x, making it more expensive than the global industrial REITs average of 16.7x, but less expensive than its direct peers averaging 32.2x. With the last close price at $61.16, the market is valuing the stock above the broader sector but below the typical peer company.
The price-to-earnings ratio compares a company’s current share price to its per-share earnings. It serves as a common shortcut for judging how much investors are willing to pay today for a dollar of future earnings. For REITs like Terreno, which tend to have steady cash flows and payout ratios, this measure can indicate how much the market believes in their future earning power and rental income stability.
Terreno’s P/E multiple stands above the industry average but remains lower than the average of its peer group. This suggests that while the market prices in confidence about its growth prospects and lease portfolio, it does not reach the premium level awarded to the highest-valued companies in the group. Compared to the fair P/E ratio estimate of 21.4x, the current level suggests the market leaves some room for upside if future results justify a move higher.
Explore the SWS fair ratio for Terreno Realty
Result: Price-to-Earnings of 19.8x (ABOUT RIGHT)
However, investors should note that any slowdown in annual revenue growth or continued declines in net income could quickly change the market’s outlook for Terreno Realty.
Find out about the key risks to this Terreno Realty narrative.
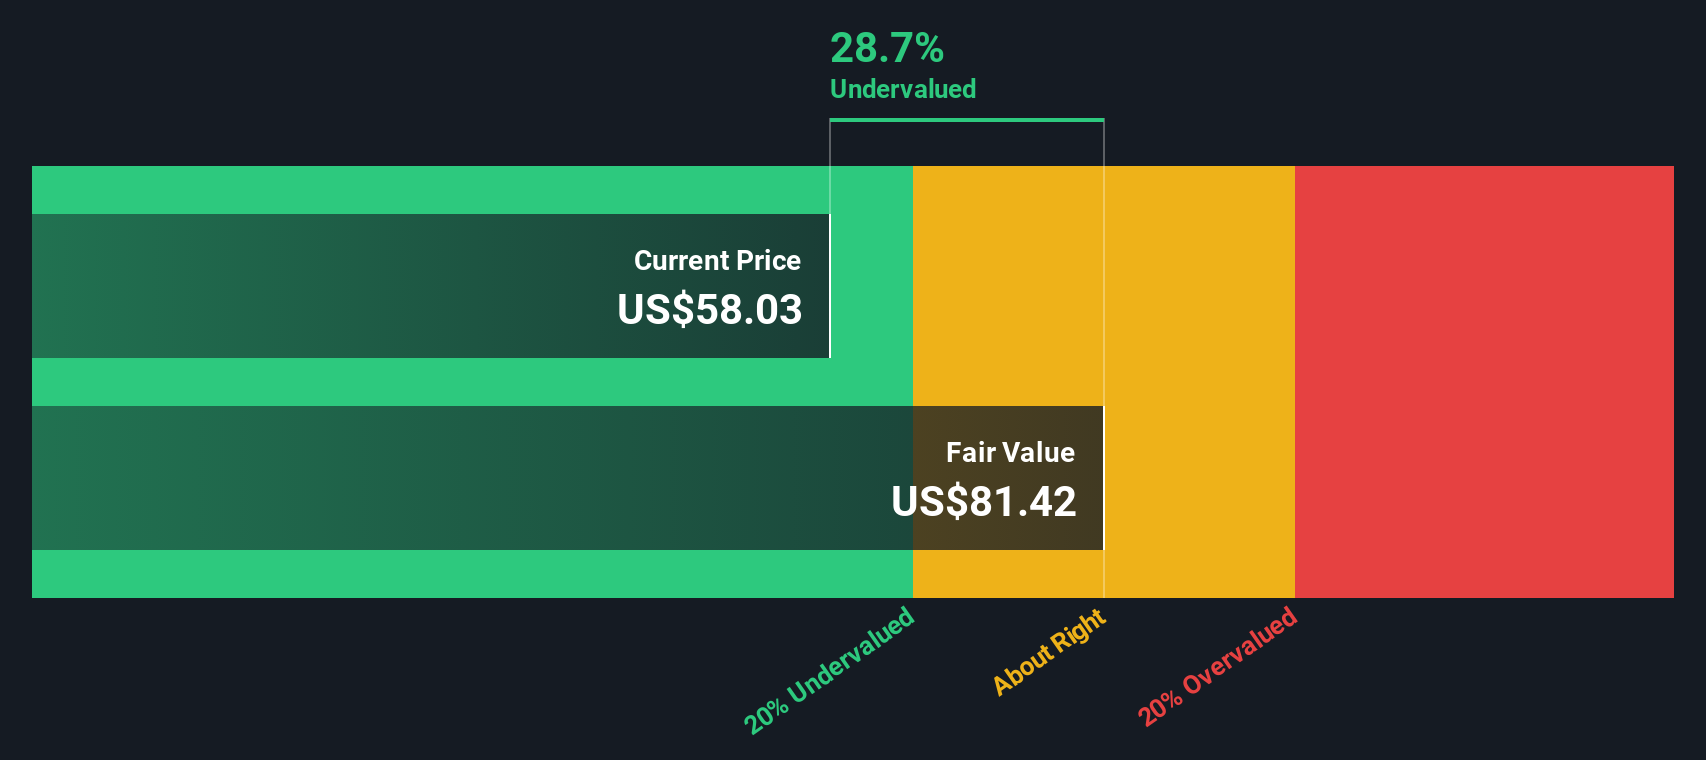
Another View: DCF Model Points to Undervaluation
Looking at Terreno Realty through the lens of our SWS DCF model offers a different take. The current share price of $61.16 sits about 11.9% below our estimate of fair value at $69.44. This points to some potential upside based on long-term cash flows, even as the market weighs other risks.
Look into how the SWS DCF model arrives at its fair value.
Simply Wall St performs a discounted cash flow (DCF) on every stock in the world every day (check out Terreno Realty for example). We show the entire calculation in full. You can track the result in your watchlist or portfolio and be alerted when this changes, or use our stock screener to discover 865 undervalued stocks based on their cash flows. If you save a screener we even alert you when new companies match - so you never miss a potential opportunity.
Build Your Own Terreno Realty Narrative
If you want to dig deeper, challenge these findings, or simply prefer hands-on analysis, you can craft your own Terreno Realty perspective in just minutes. Do it your way
A great starting point for your Terreno Realty research is our analysis highlighting 4 key rewards and 3 important warning signs that could impact your investment decision.
Looking for More Investment Ideas?
Put yourself ahead of the game and don’t let great opportunities slip by. The Simply Wall Street Screener can connect you with unique stocks making headlines right now.
- Boost your portfolio’s stability and long-term growth by checking out these 16 dividend stocks with yields > 3% with yields topping 3%.
- Seize innovation-rich opportunities in the healthcare sector with these 32 healthcare AI stocks. This area is transforming patient outcomes and redefining the industry.
- Capitalize on market inefficiencies by targeting these 865 undervalued stocks based on cash flows, which are trading below their fair value based on robust cash flow metrics.
This article by Simply Wall St is general in nature. We provide commentary based on historical data and analyst forecasts only using an unbiased methodology and our articles are not intended to be financial advice. It does not constitute a recommendation to buy or sell any stock, and does not take account of your objectives, or your financial situation. We aim to bring you long-term focused analysis driven by fundamental data. Note that our analysis may not factor in the latest price-sensitive company announcements or qualitative material. Simply Wall St has no position in any stocks mentioned.
Valuation is complex, but we're here to simplify it.
Discover if Terreno Realty might be undervalued or overvalued with our detailed analysis, featuring fair value estimates, potential risks, dividends, insider trades, and its financial condition.
Access Free AnalysisHave feedback on this article? Concerned about the content? Get in touch with us directly. Alternatively, email editorial-team@simplywallst.com
About NYSE:TRNO
Terreno Realty
Terreno Realty Corporation (“Terreno”, and together with its subsidiaries, the “Company”) acquires, owns and operates industrial real estate in six major coastal U.S.
Established dividend payer with proven track record.
Similar Companies
Market Insights

Advertisement
Community Narratives
The "Molecular Pencil": Why Beam's Technology is Built to Win
Fair Value US$65.01|66.7% undervalued
DA
Community Contributor
The silent giant behind virtually every advanced chip powering AI, smartphones, and modern infrastructure.
Fair Value US$310.00|4.8% undervalued
OS
Community Contributor
ADP Stock: Solid Fundamentals, But AI Investments Test Its Margin Resilience
Fair Value US$387.77|34.5% undervalued
YI
Community Contributor
MINISO's fair value is projected at 26.69 with an anticipated PE ratio shift of 20x
Fair Value US$24.03|9.6% undervalued
BE
Community Contributor