Stock Analysis
- United States
- /
- Media
- /
- NasdaqGS:SIRI
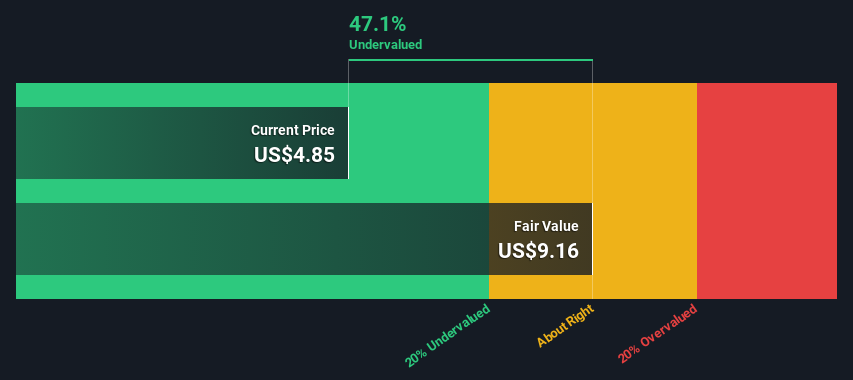
An Intrinsic Calculation For Sirius XM Holdings Inc. (NASDAQ:SIRI) Suggests It's 47% Undervalued


Key Insights
- Sirius XM Holdings' estimated fair value is US$9.16 based on 2 Stage Free Cash Flow to Equity
- Current share price of US$4.85 suggests Sirius XM Holdings is potentially 47% undervalued
- Our fair value estimate is 80% higher than Sirius XM Holdings' analyst price target of US$5.10
In this article we are going to estimate the intrinsic value of Sirius XM Holdings Inc. (NASDAQ:SIRI) by taking the expected future cash flows and discounting them to today's value. The Discounted Cash Flow (DCF) model is the tool we will apply to do this. Don't get put off by the jargon, the math behind it is actually quite straightforward.
We would caution that there are many ways of valuing a company and, like the DCF, each technique has advantages and disadvantages in certain scenarios. If you want to learn more about discounted cash flow, the rationale behind this calculation can be read in detail in the Simply Wall St analysis model.
See our latest analysis for Sirius XM Holdings
Is Sirius XM Holdings Fairly Valued?
We're using the 2-stage growth model, which simply means we take in account two stages of company's growth. In the initial period the company may have a higher growth rate and the second stage is usually assumed to have a stable growth rate. To begin with, we have to get estimates of the next ten years of cash flows. Where possible we use analyst estimates, but when these aren't available we extrapolate the previous free cash flow (FCF) from the last estimate or reported value. We assume companies with shrinking free cash flow will slow their rate of shrinkage, and that companies with growing free cash flow will see their growth rate slow, over this period. We do this to reflect that growth tends to slow more in the early years than it does in later years.
A DCF is all about the idea that a dollar in the future is less valuable than a dollar today, and so the sum of these future cash flows is then discounted to today's value:
10-year free cash flow (FCF) forecast
| 2024 | 2025 | 2026 | 2027 | 2028 | 2029 | 2030 | 2031 | 2032 | 2033 | |
| Levered FCF ($, Millions) | US$1.30b | US$1.53b | US$1.80b | US$1.93b | US$2.03b | US$2.11b | US$2.19b | US$2.26b | US$2.32b | US$2.38b |
| Growth Rate Estimate Source | Analyst x9 | Analyst x8 | Analyst x3 | Analyst x2 | Est @ 5.00% | Est @ 4.17% | Est @ 3.58% | Est @ 3.17% | Est @ 2.89% | Est @ 2.69% |
| Present Value ($, Millions) Discounted @ 7.6% | US$1.2k | US$1.3k | US$1.5k | US$1.4k | US$1.4k | US$1.4k | US$1.3k | US$1.3k | US$1.2k | US$1.2k |
("Est" = FCF growth rate estimated by Simply Wall St)
Present Value of 10-year Cash Flow (PVCF) = US$13b
The second stage is also known as Terminal Value, this is the business's cash flow after the first stage. The Gordon Growth formula is used to calculate Terminal Value at a future annual growth rate equal to the 5-year average of the 10-year government bond yield of 2.2%. We discount the terminal cash flows to today's value at a cost of equity of 7.6%.
Terminal Value (TV)= FCF2033 × (1 + g) ÷ (r – g) = US$2.4b× (1 + 2.2%) ÷ (7.6%– 2.2%) = US$46b
Present Value of Terminal Value (PVTV)= TV / (1 + r)10= US$46b÷ ( 1 + 7.6%)10= US$22b
The total value, or equity value, is then the sum of the present value of the future cash flows, which in this case is US$35b. To get the intrinsic value per share, we divide this by the total number of shares outstanding. Relative to the current share price of US$4.9, the company appears quite undervalued at a 47% discount to where the stock price trades currently. The assumptions in any calculation have a big impact on the valuation, so it is better to view this as a rough estimate, not precise down to the last cent.
Important Assumptions
Now the most important inputs to a discounted cash flow are the discount rate, and of course, the actual cash flows. If you don't agree with these result, have a go at the calculation yourself and play with the assumptions. The DCF also does not consider the possible cyclicality of an industry, or a company's future capital requirements, so it does not give a full picture of a company's potential performance. Given that we are looking at Sirius XM Holdings as potential shareholders, the cost of equity is used as the discount rate, rather than the cost of capital (or weighted average cost of capital, WACC) which accounts for debt. In this calculation we've used 7.6%, which is based on a levered beta of 1.067. Beta is a measure of a stock's volatility, compared to the market as a whole. We get our beta from the industry average beta of globally comparable companies, with an imposed limit between 0.8 and 2.0, which is a reasonable range for a stable business.
SWOT Analysis for Sirius XM Holdings
- Earnings growth over the past year exceeded the industry.
- Debt is well covered by earnings and cashflows.
- Dividends are covered by earnings and cash flows.
- Dividend is low compared to the top 25% of dividend payers in the Media market.
- Annual earnings are forecast to grow for the next 3 years.
- Good value based on P/E ratio and estimated fair value.
- Significant insider buying over the past 3 months.
- Total liabilities exceed total assets, which raises the risk of financial distress.
- Annual earnings are forecast to grow slower than the American market.
Looking Ahead:
Valuation is only one side of the coin in terms of building your investment thesis, and it is only one of many factors that you need to assess for a company. It's not possible to obtain a foolproof valuation with a DCF model. Rather it should be seen as a guide to "what assumptions need to be true for this stock to be under/overvalued?" For example, changes in the company's cost of equity or the risk free rate can significantly impact the valuation. Can we work out why the company is trading at a discount to intrinsic value? For Sirius XM Holdings, there are three fundamental aspects you should look at:
- Risks: Be aware that Sirius XM Holdings is showing 3 warning signs in our investment analysis , and 1 of those is a bit concerning...
- Management:Have insiders been ramping up their shares to take advantage of the market's sentiment for SIRI's future outlook? Check out our management and board analysis with insights on CEO compensation and governance factors.
- Other Solid Businesses: Low debt, high returns on equity and good past performance are fundamental to a strong business. Why not explore our interactive list of stocks with solid business fundamentals to see if there are other companies you may not have considered!
PS. The Simply Wall St app conducts a discounted cash flow valuation for every stock on the NASDAQGS every day. If you want to find the calculation for other stocks just search here.
Valuation is complex, but we're helping make it simple.
Find out whether Sirius XM Holdings is potentially over or undervalued by checking out our comprehensive analysis, which includes fair value estimates, risks and warnings, dividends, insider transactions and financial health.
View the Free AnalysisHave feedback on this article? Concerned about the content? Get in touch with us directly. Alternatively, email editorial-team (at) simplywallst.com.
This article by Simply Wall St is general in nature. We provide commentary based on historical data and analyst forecasts only using an unbiased methodology and our articles are not intended to be financial advice. It does not constitute a recommendation to buy or sell any stock, and does not take account of your objectives, or your financial situation. We aim to bring you long-term focused analysis driven by fundamental data. Note that our analysis may not factor in the latest price-sensitive company announcements or qualitative material. Simply Wall St has no position in any stocks mentioned.
About NasdaqGS:SIRI
Sirius XM Holdings
Sirius XM Holdings Inc. operates as an audio entertainment company in North America.
Solid track record and good value.
