
Advertisement
- United States
- /
- Media
- /
- NasdaqGM:PUBM
Is PubMatic, Inc.'s (NASDAQ:PUBM) Recent Price Movement Underpinned By Its Weak Fundamentals?
It is hard to get excited after looking at PubMatic's (NASDAQ:PUBM) recent performance, when its stock has declined 31% over the past three months. It seems that the market might have completely ignored the positive aspects of the company's fundamentals and decided to weigh-in more on the negative aspects. Fundamentals usually dictate market outcomes so it makes sense to study the company's financials. Particularly, we will be paying attention to PubMatic's ROE today.
Return on equity or ROE is a key measure used to assess how efficiently a company's management is utilizing the company's capital. In other words, it is a profitability ratio which measures the rate of return on the capital provided by the company's shareholders.
View our latest analysis for PubMatic
How Do You Calculate Return On Equity?
The formula for ROE is:
Return on Equity = Net Profit (from continuing operations) ÷ Shareholders' Equity
So, based on the above formula, the ROE for PubMatic is:
7.1% = US$20m ÷ US$283m (Based on the trailing twelve months to June 2024).
The 'return' refers to a company's earnings over the last year. That means that for every $1 worth of shareholders' equity, the company generated $0.07 in profit.
What Has ROE Got To Do With Earnings Growth?
Thus far, we have learned that ROE measures how efficiently a company is generating its profits. Depending on how much of these profits the company reinvests or "retains", and how effectively it does so, we are then able to assess a company’s earnings growth potential. Assuming everything else remains unchanged, the higher the ROE and profit retention, the higher the growth rate of a company compared to companies that don't necessarily bear these characteristics.
PubMatic's Earnings Growth And 7.1% ROE
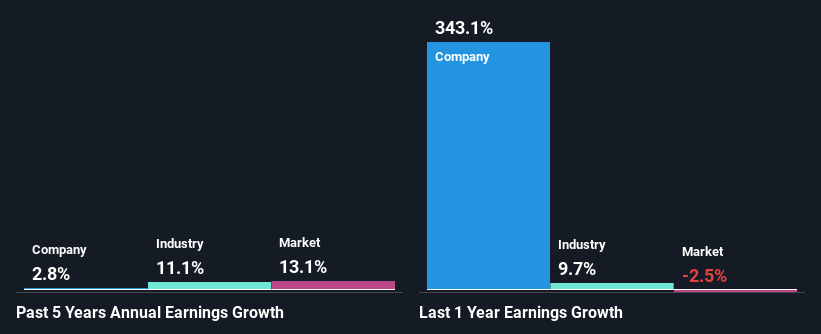
When you first look at it, PubMatic's ROE doesn't look that attractive. Next, when compared to the average industry ROE of 13%, the company's ROE leaves us feeling even less enthusiastic. As a result, PubMatic reported a very low income growth of 2.8% over the past five years.
We then compared PubMatic's net income growth with the industry and found that the company's growth figure is lower than the average industry growth rate of 11% in the same 5-year period, which is a bit concerning.
Earnings growth is a huge factor in stock valuation. It’s important for an investor to know whether the market has priced in the company's expected earnings growth (or decline). By doing so, they will have an idea if the stock is headed into clear blue waters or if swampy waters await. One good indicator of expected earnings growth is the P/E ratio which determines the price the market is willing to pay for a stock based on its earnings prospects. So, you may want to check if PubMatic is trading on a high P/E or a low P/E, relative to its industry.
Is PubMatic Making Efficient Use Of Its Profits?
PubMatic doesn't pay any regular dividends currently which essentially means that it has been reinvesting all of its profits into the business. This doesn't explain the low earnings growth number that we discussed above. Therefore, there might be some other reasons to explain the lack in that respect. For example, the business could be in decline.
Summary
On the whole, we feel that the performance shown by PubMatic can be open to many interpretations. While the company does have a high rate of profit retention, its low rate of return is probably hampering its earnings growth. Having said that, on studying current analyst estimates, we were concerned to see that while the company has grown its earnings in the past, analysts expect its earnings to shrink in the future. To know more about the company's future earnings growth forecasts take a look at this free report on analyst forecasts for the company to find out more.
New: Manage All Your Stock Portfolios in One Place
We've created the ultimate portfolio companion for stock investors, and it's free.
• Connect an unlimited number of Portfolios and see your total in one currency
• Be alerted to new Warning Signs or Risks via email or mobile
• Track the Fair Value of your stocks
Have feedback on this article? Concerned about the content? Get in touch with us directly. Alternatively, email editorial-team (at) simplywallst.com.
This article by Simply Wall St is general in nature. We provide commentary based on historical data and analyst forecasts only using an unbiased methodology and our articles are not intended to be financial advice. It does not constitute a recommendation to buy or sell any stock, and does not take account of your objectives, or your financial situation. We aim to bring you long-term focused analysis driven by fundamental data. Note that our analysis may not factor in the latest price-sensitive company announcements or qualitative material. Simply Wall St has no position in any stocks mentioned.
About NasdaqGM:PUBM
PubMatic
A technology company, engages in the provision of a cloud infrastructure platform that enables real time programmatic advertising transactions for digital content creators, advertisers, agencies, agency trading desks, and demand side platforms worldwide.
Flawless balance sheet and fair value.
Similar Companies
Market Insights

Advertisement
Community Narratives
The company that turned a verb into a global necessity and basically runs the modern internet, digital ads, smartphones, maps, and AI.
Fair Value US$300.00|7.1% undervalued
OS
Community Contributor
Flowers Foods Pays A Fair Price For Health
Fair Value US$16.12|26.4% undervalued
NV
Community Contributor
TMX Group will thrive with 33.3% profit margin and enduring market moat
Fair Value CA$49.90|0.8% overvalued
LI
Community Contributor
The "Molecular Pencil": Why Beam's Technology is Built to Win
Fair Value US$65.01|65.8% undervalued
DA
Community Contributor