- United States
- /
- Interactive Media and Services
- /
- NasdaqGS:ANGI
Angi (NASDAQ:ANGI) Is Making Moderate Use Of Debt


David Iben put it well when he said, 'Volatility is not a risk we care about. What we care about is avoiding the permanent loss of capital.' So it might be obvious that you need to consider debt, when you think about how risky any given stock is, because too much debt can sink a company. We note that Angi Inc. (NASDAQ:ANGI) does have debt on its balance sheet. But the more important question is: how much risk is that debt creating?
When Is Debt A Problem?
Generally speaking, debt only becomes a real problem when a company can't easily pay it off, either by raising capital or with its own cash flow. If things get really bad, the lenders can take control of the business. However, a more frequent (but still costly) occurrence is where a company must issue shares at bargain-basement prices, permanently diluting shareholders, just to shore up its balance sheet. Of course, debt can be an important tool in businesses, particularly capital heavy businesses. When we examine debt levels, we first consider both cash and debt levels, together.
Check out our latest analysis for Angi
How Much Debt Does Angi Carry?
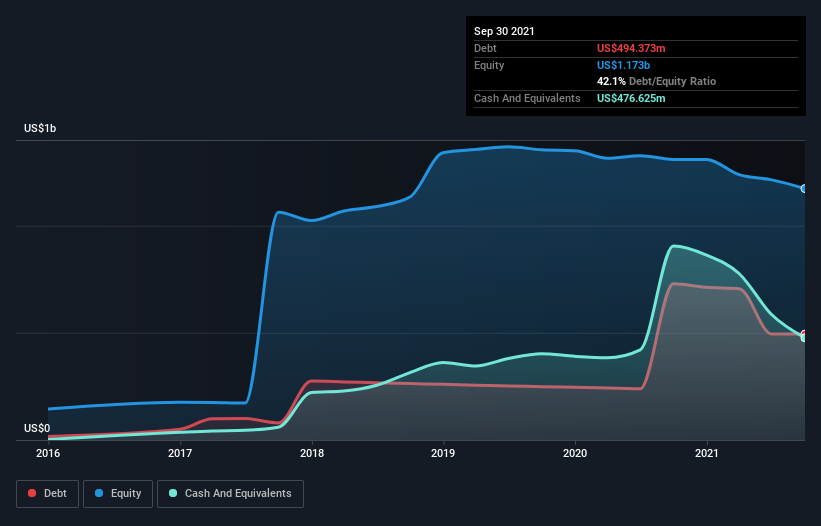
The image below, which you can click on for greater detail, shows that Angi had debt of US$494.4m at the end of September 2021, a reduction from US$729.2m over a year. However, because it has a cash reserve of US$476.6m, its net debt is less, at about US$17.7m.
How Strong Is Angi's Balance Sheet?
Zooming in on the latest balance sheet data, we can see that Angi had liabilities of US$303.3m due within 12 months and liabilities of US$598.4m due beyond that. On the other hand, it had cash of US$476.6m and US$98.5m worth of receivables due within a year. So its liabilities outweigh the sum of its cash and (near-term) receivables by US$326.5m.
Since publicly traded Angi shares are worth a total of US$5.54b, it seems unlikely that this level of liabilities would be a major threat. Having said that, it's clear that we should continue to monitor its balance sheet, lest it change for the worse. But either way, Angi has virtually no net debt, so it's fair to say it does not have a heavy debt load! The balance sheet is clearly the area to focus on when you are analysing debt. But it is future earnings, more than anything, that will determine Angi's ability to maintain a healthy balance sheet going forward. So if you're focused on the future you can check out this free report showing analyst profit forecasts.
Over 12 months, Angi reported revenue of US$1.6b, which is a gain of 14%, although it did not report any earnings before interest and tax. That rate of growth is a bit slow for our taste, but it takes all types to make a world.
Caveat Emptor
Over the last twelve months Angi produced an earnings before interest and tax (EBIT) loss. To be specific the EBIT loss came in at US$52m. Considering that alongside the liabilities mentioned above does not give us much confidence that company should be using so much debt. Quite frankly we think the balance sheet is far from match-fit, although it could be improved with time. Another cause for caution is that is bled US$26m in negative free cash flow over the last twelve months. So to be blunt we think it is risky. When analysing debt levels, the balance sheet is the obvious place to start. However, not all investment risk resides within the balance sheet - far from it. Case in point: We've spotted 1 warning sign for Angi you should be aware of.
When all is said and done, sometimes its easier to focus on companies that don't even need debt. Readers can access a list of growth stocks with zero net debt 100% free, right now.
New: Manage All Your Stock Portfolios in One Place
We've created the ultimate portfolio companion for stock investors, and it's free.
• Connect an unlimited number of Portfolios and see your total in one currency
• Be alerted to new Warning Signs or Risks via email or mobile
• Track the Fair Value of your stocks
This article by Simply Wall St is general in nature. We provide commentary based on historical data and analyst forecasts only using an unbiased methodology and our articles are not intended to be financial advice. It does not constitute a recommendation to buy or sell any stock, and does not take account of your objectives, or your financial situation. We aim to bring you long-term focused analysis driven by fundamental data. Note that our analysis may not factor in the latest price-sensitive company announcements or qualitative material. Simply Wall St has no position in any stocks mentioned.
Have feedback on this article? Concerned about the content? Get in touch with us directly. Alternatively, email editorial-team (at) simplywallst.com.
About NasdaqGS:ANGI
Angi
Angi Inc. connects home service professionals with consumers in the United States and internationally.
Undervalued with adequate balance sheet.

