Stock Analysis
- United States
- /
- Basic Materials
- /
- NYSE:MLM
A Look At The Fair Value Of Martin Marietta Materials, Inc. (NYSE:MLM)
Key Insights
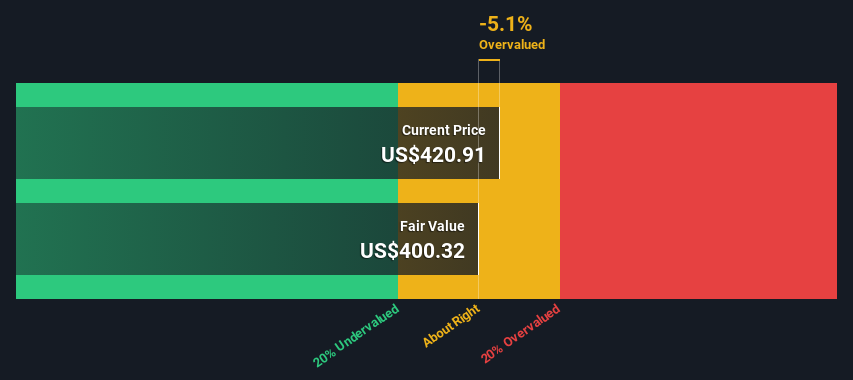
- Using the 2 Stage Free Cash Flow to Equity, Martin Marietta Materials fair value estimate is US$400
- Martin Marietta Materials' US$421 share price indicates it is trading at similar levels as its fair value estimate
- Analyst price target for MLM is US$496, which is 24% above our fair value estimate
In this article we are going to estimate the intrinsic value of Martin Marietta Materials, Inc. (NYSE:MLM) by taking the expected future cash flows and discounting them to their present value. Our analysis will employ the Discounted Cash Flow (DCF) model. Believe it or not, it's not too difficult to follow, as you'll see from our example!
Remember though, that there are many ways to estimate a company's value, and a DCF is just one method. If you want to learn more about discounted cash flow, the rationale behind this calculation can be read in detail in the Simply Wall St analysis model.
See our latest analysis for Martin Marietta Materials
Step By Step Through The Calculation
We use what is known as a 2-stage model, which simply means we have two different periods of growth rates for the company's cash flows. Generally the first stage is higher growth, and the second stage is a lower growth phase. In the first stage we need to estimate the cash flows to the business over the next ten years. Where possible we use analyst estimates, but when these aren't available we extrapolate the previous free cash flow (FCF) from the last estimate or reported value. We assume companies with shrinking free cash flow will slow their rate of shrinkage, and that companies with growing free cash flow will see their growth rate slow, over this period. We do this to reflect that growth tends to slow more in the early years than it does in later years.
Generally we assume that a dollar today is more valuable than a dollar in the future, so we discount the value of these future cash flows to their estimated value in today's dollars:
10-year free cash flow (FCF) forecast
| 2024 | 2025 | 2026 | 2027 | 2028 | 2029 | 2030 | 2031 | 2032 | 2033 | |
| Levered FCF ($, Millions) | US$960.6m | US$1.16b | US$1.20b | US$1.25b | US$1.28b | US$1.32b | US$1.35b | US$1.38b | US$1.41b | US$1.44b |
| Growth Rate Estimate Source | Analyst x5 | Analyst x2 | Analyst x1 | Analyst x1 | Est @ 2.85% | Est @ 2.64% | Est @ 2.50% | Est @ 2.39% | Est @ 2.32% | Est @ 2.27% |
| Present Value ($, Millions) Discounted @ 6.9% | US$899 | US$1.0k | US$985 | US$954 | US$918 | US$881 | US$845 | US$809 | US$775 | US$741 |
("Est" = FCF growth rate estimated by Simply Wall St)
Present Value of 10-year Cash Flow (PVCF) = US$8.8b
The second stage is also known as Terminal Value, this is the business's cash flow after the first stage. For a number of reasons a very conservative growth rate is used that cannot exceed that of a country's GDP growth. In this case we have used the 5-year average of the 10-year government bond yield (2.2%) to estimate future growth. In the same way as with the 10-year 'growth' period, we discount future cash flows to today's value, using a cost of equity of 6.9%.
Terminal Value (TV)= FCF2033 × (1 + g) ÷ (r – g) = US$1.4b× (1 + 2.2%) ÷ (6.9%– 2.2%) = US$31b
Present Value of Terminal Value (PVTV)= TV / (1 + r)10= US$31b÷ ( 1 + 6.9%)10= US$16b
The total value, or equity value, is then the sum of the present value of the future cash flows, which in this case is US$25b. In the final step we divide the equity value by the number of shares outstanding. Relative to the current share price of US$421, the company appears around fair value at the time of writing. The assumptions in any calculation have a big impact on the valuation, so it is better to view this as a rough estimate, not precise down to the last cent.
Important Assumptions
Now the most important inputs to a discounted cash flow are the discount rate, and of course, the actual cash flows. If you don't agree with these result, have a go at the calculation yourself and play with the assumptions. The DCF also does not consider the possible cyclicality of an industry, or a company's future capital requirements, so it does not give a full picture of a company's potential performance. Given that we are looking at Martin Marietta Materials as potential shareholders, the cost of equity is used as the discount rate, rather than the cost of capital (or weighted average cost of capital, WACC) which accounts for debt. In this calculation we've used 6.9%, which is based on a levered beta of 0.951. Beta is a measure of a stock's volatility, compared to the market as a whole. We get our beta from the industry average beta of globally comparable companies, with an imposed limit between 0.8 and 2.0, which is a reasonable range for a stable business.
SWOT Analysis for Martin Marietta Materials
- Earnings growth over the past year exceeded the industry.
- Debt is well covered by earnings and cashflows.
- Dividend is low compared to the top 25% of dividend payers in the Basic Materials market.
- Expensive based on P/E ratio and estimated fair value.
- Annual revenue is forecast to grow faster than the American market.
- Annual earnings are forecast to grow slower than the American market.
Moving On:
Valuation is only one side of the coin in terms of building your investment thesis, and it ideally won't be the sole piece of analysis you scrutinize for a company. The DCF model is not a perfect stock valuation tool. Instead the best use for a DCF model is to test certain assumptions and theories to see if they would lead to the company being undervalued or overvalued. If a company grows at a different rate, or if its cost of equity or risk free rate changes sharply, the output can look very different. For Martin Marietta Materials, we've put together three fundamental elements you should explore:
- Risks: To that end, you should be aware of the 2 warning signs we've spotted with Martin Marietta Materials .
- Management:Have insiders been ramping up their shares to take advantage of the market's sentiment for MLM's future outlook? Check out our management and board analysis with insights on CEO compensation and governance factors.
- Other Solid Businesses: Low debt, high returns on equity and good past performance are fundamental to a strong business. Why not explore our interactive list of stocks with solid business fundamentals to see if there are other companies you may not have considered!
PS. Simply Wall St updates its DCF calculation for every American stock every day, so if you want to find the intrinsic value of any other stock just search here.
Valuation is complex, but we're helping make it simple.
Find out whether Martin Marietta Materials is potentially over or undervalued by checking out our comprehensive analysis, which includes fair value estimates, risks and warnings, dividends, insider transactions and financial health.
View the Free AnalysisHave feedback on this article? Concerned about the content? Get in touch with us directly. Alternatively, email editorial-team (at) simplywallst.com.
This article by Simply Wall St is general in nature. We provide commentary based on historical data and analyst forecasts only using an unbiased methodology and our articles are not intended to be financial advice. It does not constitute a recommendation to buy or sell any stock, and does not take account of your objectives, or your financial situation. We aim to bring you long-term focused analysis driven by fundamental data. Note that our analysis may not factor in the latest price-sensitive company announcements or qualitative material. Simply Wall St has no position in any stocks mentioned.
About NYSE:MLM
Martin Marietta Materials
Martin Marietta Materials, Inc., a natural resource-based building materials company, supplies aggregates and heavy-side building materials to the construction industry in the United States and internationally.
Excellent balance sheet with proven track record.

