- United States
- /
- Insurance
- /
- NYSE:MET
Investors more bullish on MetLife (NYSE:MET) this week as stock lifts 3.2%, despite earnings trending downwards over past five years


If you buy and hold a stock for many years, you'd hope to be making a profit. But more than that, you probably want to see it rise more than the market average. But MetLife, Inc. (NYSE:MET) has fallen short of that second goal, with a share price rise of 71% over five years, which is below the market return. Looking at the last year alone, the stock is up 19%.
On the back of a solid 7-day performance, let's check what role the company's fundamentals have played in driving long term shareholder returns.
View our latest analysis for MetLife
In his essay The Superinvestors of Graham-and-Doddsville Warren Buffett described how share prices do not always rationally reflect the value of a business. One imperfect but simple way to consider how the market perception of a company has shifted is to compare the change in the earnings per share (EPS) with the share price movement.
During five years of share price growth, MetLife actually saw its EPS drop 8.8% per year.
This means it's unlikely the market is judging the company based on earnings growth. Since the change in EPS doesn't seem to correlate with the change in share price, it's worth taking a look at other metrics.
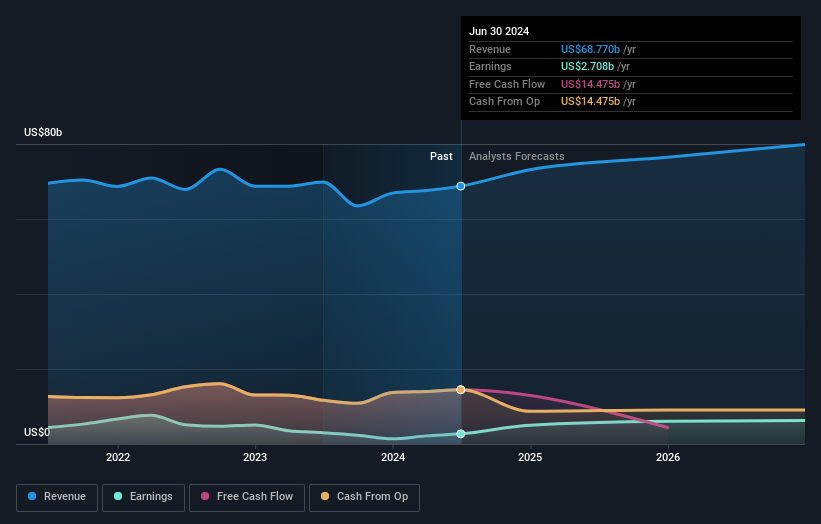
The revenue reduction of 0.02% per year is not a positive. It certainly surprises us that the share price is up, but perhaps a closer examination of the data will yield answers.
The graphic below depicts how earnings and revenue have changed over time (unveil the exact values by clicking on the image).
MetLife is well known by investors, and plenty of clever analysts have tried to predict the future profit levels. If you are thinking of buying or selling MetLife stock, you should check out this free report showing analyst consensus estimates for future profits.
What About Dividends?
It is important to consider the total shareholder return, as well as the share price return, for any given stock. Whereas the share price return only reflects the change in the share price, the TSR includes the value of dividends (assuming they were reinvested) and the benefit of any discounted capital raising or spin-off. So for companies that pay a generous dividend, the TSR is often a lot higher than the share price return. As it happens, MetLife's TSR for the last 5 years was 103%, which exceeds the share price return mentioned earlier. And there's no prize for guessing that the dividend payments largely explain the divergence!
A Different Perspective
MetLife shareholders have received returns of 23% over twelve months (even including dividends), which isn't far from the general market return. Most would be happy with a gain, and it helps that the year's return is actually better than the average return over five years, which was 15%. It is possible that management foresight will bring growth well into the future, even if the share price slows down. It's always interesting to track share price performance over the longer term. But to understand MetLife better, we need to consider many other factors. Consider risks, for instance. Every company has them, and we've spotted 1 warning sign for MetLife you should know about.
But note: MetLife may not be the best stock to buy. So take a peek at this free list of interesting companies with past earnings growth (and further growth forecast).
Please note, the market returns quoted in this article reflect the market weighted average returns of stocks that currently trade on American exchanges.
New: Manage All Your Stock Portfolios in One Place
We've created the ultimate portfolio companion for stock investors, and it's free.
• Connect an unlimited number of Portfolios and see your total in one currency
• Be alerted to new Warning Signs or Risks via email or mobile
• Track the Fair Value of your stocks
Have feedback on this article? Concerned about the content? Get in touch with us directly. Alternatively, email editorial-team (at) simplywallst.com.
This article by Simply Wall St is general in nature. We provide commentary based on historical data and analyst forecasts only using an unbiased methodology and our articles are not intended to be financial advice. It does not constitute a recommendation to buy or sell any stock, and does not take account of your objectives, or your financial situation. We aim to bring you long-term focused analysis driven by fundamental data. Note that our analysis may not factor in the latest price-sensitive company announcements or qualitative material. Simply Wall St has no position in any stocks mentioned.
About NYSE:MET
MetLife
A financial services company, provides insurance, annuities, employee benefits, and asset management services worldwide.
Established dividend payer with mediocre balance sheet.
