Stock Analysis
- United States
- /
- Insurance
- /
- NasdaqGS:SAFT
Safety Insurance Group, Inc.'s (NASDAQ:SAFT) Stock Financial Prospects Look Bleak: Should Shareholders Be Prepared For A Share Price Correction?


Safety Insurance Group's (NASDAQ:SAFT) stock up by 5.0% over the past week. However, in this article, we decided to focus on its weak financials, as long-term fundamentals ultimately dictate market outcomes. Particularly, we will be paying attention to Safety Insurance Group's ROE today.
ROE or return on equity is a useful tool to assess how effectively a company can generate returns on the investment it received from its shareholders. Simply put, it is used to assess the profitability of a company in relation to its equity capital.
See our latest analysis for Safety Insurance Group
How Do You Calculate Return On Equity?
The formula for return on equity is:
Return on Equity = Net Profit (from continuing operations) ÷ Shareholders' Equity
So, based on the above formula, the ROE for Safety Insurance Group is:
2.3% = US$19m ÷ US$804m (Based on the trailing twelve months to December 2023).
The 'return' is the profit over the last twelve months. That means that for every $1 worth of shareholders' equity, the company generated $0.02 in profit.
Why Is ROE Important For Earnings Growth?
So far, we've learned that ROE is a measure of a company's profitability. We now need to evaluate how much profit the company reinvests or "retains" for future growth which then gives us an idea about the growth potential of the company. Assuming all else is equal, companies that have both a higher return on equity and higher profit retention are usually the ones that have a higher growth rate when compared to companies that don't have the same features.
Safety Insurance Group's Earnings Growth And 2.3% ROE
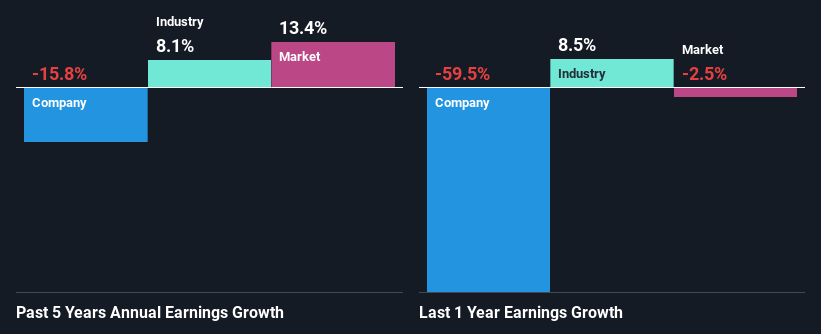
As you can see, Safety Insurance Group's ROE looks pretty weak. Not just that, even compared to the industry average of 13%, the company's ROE is entirely unremarkable. Therefore, it might not be wrong to say that the five year net income decline of 16% seen by Safety Insurance Group was possibly a result of it having a lower ROE. We reckon that there could also be other factors at play here. For example, the business has allocated capital poorly, or that the company has a very high payout ratio.
That being said, we compared Safety Insurance Group's performance with the industry and were concerned when we found that while the company has shrunk its earnings, the industry has grown its earnings at a rate of 8.1% in the same 5-year period.
Earnings growth is an important metric to consider when valuing a stock. The investor should try to establish if the expected growth or decline in earnings, whichever the case may be, is priced in. This then helps them determine if the stock is placed for a bright or bleak future. What is SAFT worth today? The intrinsic value infographic in our free research report helps visualize whether SAFT is currently mispriced by the market.
Is Safety Insurance Group Efficiently Re-investing Its Profits?
Safety Insurance Group's declining earnings is not surprising given how the company is spending most of its profits in paying dividends, judging by its three-year median payout ratio of 72% (or a retention ratio of 28%). With only a little being reinvested into the business, earnings growth would obviously be low or non-existent. You can see the 3 risks we have identified for Safety Insurance Group by visiting our risks dashboard for free on our platform here.
Moreover, Safety Insurance Group has been paying dividends for at least ten years or more suggesting that management must have perceived that the shareholders prefer dividends over earnings growth.
Conclusion
Overall, we would be extremely cautious before making any decision on Safety Insurance Group. As a result of its low ROE and lack of much reinvestment into the business, the company has seen a disappointing earnings growth rate. So far, we've only made a quick discussion around the company's earnings growth. To gain further insights into Safety Insurance Group's past profit growth, check out this visualization of past earnings, revenue and cash flows.
Valuation is complex, but we're helping make it simple.
Find out whether Safety Insurance Group is potentially over or undervalued by checking out our comprehensive analysis, which includes fair value estimates, risks and warnings, dividends, insider transactions and financial health.
View the Free AnalysisHave feedback on this article? Concerned about the content? Get in touch with us directly. Alternatively, email editorial-team (at) simplywallst.com.
This article by Simply Wall St is general in nature. We provide commentary based on historical data and analyst forecasts only using an unbiased methodology and our articles are not intended to be financial advice. It does not constitute a recommendation to buy or sell any stock, and does not take account of your objectives, or your financial situation. We aim to bring you long-term focused analysis driven by fundamental data. Note that our analysis may not factor in the latest price-sensitive company announcements or qualitative material. Simply Wall St has no position in any stocks mentioned.
About NasdaqGS:SAFT
Safety Insurance Group
Safety Insurance Group, Inc. provides private passenger and commercial automobile, and homeowner insurance in the United States.
Adequate balance sheet second-rate dividend payer.
