Stock Analysis
- United States
- /
- Medical Equipment
- /
- NYSE:RMD
Investors in ResMed (NYSE:RMD) have seen solid returns of 101% over the past five years

These days it's easy to simply buy an index fund, and your returns should (roughly) match the market. But you can do a lot better than that by buying good quality businesses for attractive prices. For example, the ResMed Inc. (NYSE:RMD) share price is 92% higher than it was five years ago, which is more than the market average. In comparison, the share price is down 3.0% in a year.
Now it's worth having a look at the company's fundamentals too, because that will help us determine if the long term shareholder return has matched the performance of the underlying business.
Check out our latest analysis for ResMed
To quote Buffett, 'Ships will sail around the world but the Flat Earth Society will flourish. There will continue to be wide discrepancies between price and value in the marketplace...' One way to examine how market sentiment has changed over time is to look at the interaction between a company's share price and its earnings per share (EPS).
During five years of share price growth, ResMed achieved compound earnings per share (EPS) growth of 16% per year. So the EPS growth rate is rather close to the annualized share price gain of 14% per year. That suggests that the market sentiment around the company hasn't changed much over that time. Rather, the share price has approximately tracked EPS growth.
The image below shows how EPS has tracked over time (if you click on the image you can see greater detail).
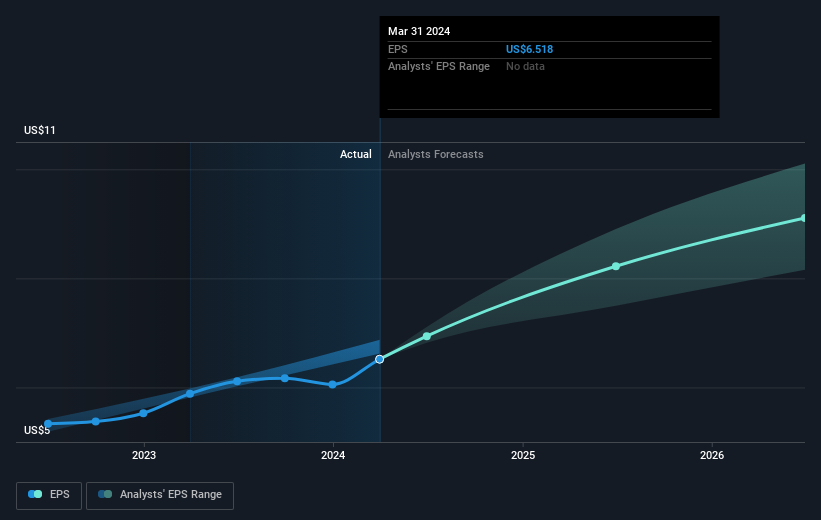
We know that ResMed has improved its bottom line lately, but is it going to grow revenue? This free report showing analyst revenue forecasts should help you figure out if the EPS growth can be sustained.
What About Dividends?
As well as measuring the share price return, investors should also consider the total shareholder return (TSR). The TSR is a return calculation that accounts for the value of cash dividends (assuming that any dividend received was reinvested) and the calculated value of any discounted capital raisings and spin-offs. It's fair to say that the TSR gives a more complete picture for stocks that pay a dividend. As it happens, ResMed's TSR for the last 5 years was 101%, which exceeds the share price return mentioned earlier. This is largely a result of its dividend payments!
A Different Perspective
ResMed shareholders are down 2.0% for the year (even including dividends), but the market itself is up 28%. Even the share prices of good stocks drop sometimes, but we want to see improvements in the fundamental metrics of a business, before getting too interested. On the bright side, long term shareholders have made money, with a gain of 15% per year over half a decade. If the fundamental data continues to indicate long term sustainable growth, the current sell-off could be an opportunity worth considering. While it is well worth considering the different impacts that market conditions can have on the share price, there are other factors that are even more important. Even so, be aware that ResMed is showing 1 warning sign in our investment analysis , you should know about...
For those who like to find winning investments this free list of undervalued companies with recent insider purchasing, could be just the ticket.
Please note, the market returns quoted in this article reflect the market weighted average returns of stocks that currently trade on American exchanges.
Valuation is complex, but we're helping make it simple.
Find out whether ResMed is potentially over or undervalued by checking out our comprehensive analysis, which includes fair value estimates, risks and warnings, dividends, insider transactions and financial health.
View the Free AnalysisHave feedback on this article? Concerned about the content? Get in touch with us directly. Alternatively, email editorial-team (at) simplywallst.com.
This article by Simply Wall St is general in nature. We provide commentary based on historical data and analyst forecasts only using an unbiased methodology and our articles are not intended to be financial advice. It does not constitute a recommendation to buy or sell any stock, and does not take account of your objectives, or your financial situation. We aim to bring you long-term focused analysis driven by fundamental data. Note that our analysis may not factor in the latest price-sensitive company announcements or qualitative material. Simply Wall St has no position in any stocks mentioned.
About NYSE:RMD
ResMed
Develops, manufactures, distributes, and markets medical devices and cloud-based software applications for the healthcare markets.
Flawless balance sheet, undervalued and pays a dividend.

