Stock Analysis
- United States
- /
- Tobacco
- /
- NYSE:UVV
Is The Market Rewarding Universal Corporation (NYSE:UVV) With A Negative Sentiment As A Result Of Its Mixed Fundamentals?

Universal (NYSE:UVV) has had a rough month with its share price down 12%. We, however decided to study the company's financials to determine if they have got anything to do with the price decline. Stock prices are usually driven by a company’s financial performance over the long term, and therefore we decided to pay more attention to the company's financial performance. Specifically, we decided to study Universal's ROE in this article.
ROE or return on equity is a useful tool to assess how effectively a company can generate returns on the investment it received from its shareholders. In short, ROE shows the profit each dollar generates with respect to its shareholder investments.
See our latest analysis for Universal
How Is ROE Calculated?
The formula for return on equity is:
Return on Equity = Net Profit (from continuing operations) ÷ Shareholders' Equity
So, based on the above formula, the ROE for Universal is:
9.8% = US$144m ÷ US$1.5b (Based on the trailing twelve months to December 2023).
The 'return' is the profit over the last twelve months. So, this means that for every $1 of its shareholder's investments, the company generates a profit of $0.10.
Why Is ROE Important For Earnings Growth?
We have already established that ROE serves as an efficient profit-generating gauge for a company's future earnings. We now need to evaluate how much profit the company reinvests or "retains" for future growth which then gives us an idea about the growth potential of the company. Assuming all else is equal, companies that have both a higher return on equity and higher profit retention are usually the ones that have a higher growth rate when compared to companies that don't have the same features.
Universal's Earnings Growth And 9.8% ROE
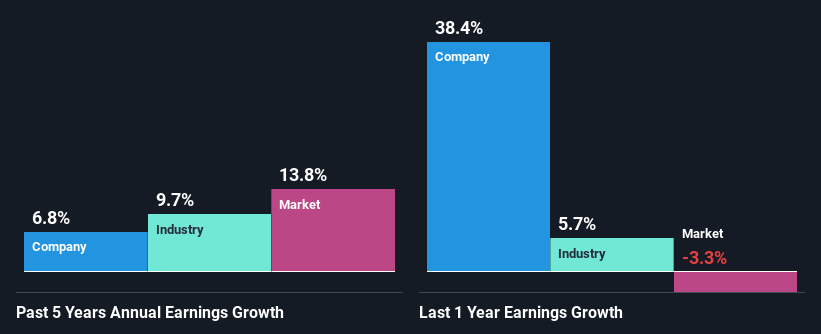
When you first look at it, Universal's ROE doesn't look that attractive. A quick further study shows that the company's ROE doesn't compare favorably to the industry average of 22% either. Universal was still able to see a decent net income growth of 6.8% over the past five years. So, the growth in the company's earnings could probably have been caused by other variables. Such as - high earnings retention or an efficient management in place.
We then compared Universal's net income growth with the industry and found that the company's growth figure is lower than the average industry growth rate of 9.7% in the same 5-year period, which is a bit concerning.
Earnings growth is a huge factor in stock valuation. It’s important for an investor to know whether the market has priced in the company's expected earnings growth (or decline). This then helps them determine if the stock is placed for a bright or bleak future. One good indicator of expected earnings growth is the P/E ratio which determines the price the market is willing to pay for a stock based on its earnings prospects. So, you may want to check if Universal is trading on a high P/E or a low P/E, relative to its industry.
Is Universal Efficiently Re-investing Its Profits?
Universal has a significant three-year median payout ratio of 81%, meaning that it is left with only 19% to reinvest into its business. This implies that the company has been able to achieve decent earnings growth despite returning most of its profits to shareholders.
Moreover, Universal is determined to keep sharing its profits with shareholders which we infer from its long history of paying a dividend for at least ten years.
Summary
On the whole, we feel that the performance shown by Universal can be open to many interpretations. While no doubt its earnings growth is pretty respectable, the low profit retention could mean that the company's earnings growth could have been higher, had it been paying reinvesting a higher portion of its profits. An improvement in its ROE could also help future earnings growth. So far, we've only made a quick discussion around the company's earnings growth. You can do your own research on Universal and see how it has performed in the past by looking at this FREE detailed graph of past earnings, revenue and cash flows.
Valuation is complex, but we're helping make it simple.
Find out whether Universal is potentially over or undervalued by checking out our comprehensive analysis, which includes fair value estimates, risks and warnings, dividends, insider transactions and financial health.
View the Free AnalysisHave feedback on this article? Concerned about the content? Get in touch with us directly. Alternatively, email editorial-team (at) simplywallst.com.
This article by Simply Wall St is general in nature. We provide commentary based on historical data and analyst forecasts only using an unbiased methodology and our articles are not intended to be financial advice. It does not constitute a recommendation to buy or sell any stock, and does not take account of your objectives, or your financial situation. We aim to bring you long-term focused analysis driven by fundamental data. Note that our analysis may not factor in the latest price-sensitive company announcements or qualitative material. Simply Wall St has no position in any stocks mentioned.
About NYSE:UVV
Universal
Universal Corporation processes and supplies leaf tobacco and plant-based ingredients worldwide.
Solid track record established dividend payer.

