Stock Analysis
- United States
- /
- Food
- /
- NYSE:K
The one-year underlying earnings growth at Kellanova (NYSE:K) is promising, but the shareholders are still in the red over that time

It's easy to match the overall market return by buying an index fund. When you buy individual stocks, you can make higher profits, but you also face the risk of under-performance. Investors in Kellanova (NYSE:K) have tasted that bitter downside in the last year, as the share price dropped 18%. That's disappointing when you consider the market returned 23%. At least the damage isn't so bad if you look at the last three years, since the stock is down 13% in that time.
With the stock having lost 3.6% in the past week, it's worth taking a look at business performance and seeing if there's any red flags.
Check out our latest analysis for Kellanova
While markets are a powerful pricing mechanism, share prices reflect investor sentiment, not just underlying business performance. One imperfect but simple way to consider how the market perception of a company has shifted is to compare the change in the earnings per share (EPS) with the share price movement.
During the unfortunate twelve months during which the Kellanova share price fell, it actually saw its earnings per share (EPS) improve by 5.0%. Of course, the situation might betray previous over-optimism about growth.
It seems quite likely that the market was expecting higher growth from the stock. But looking to other metrics might better explain the share price change.
Vibrant companies don't usually cut their dividends, so the recent reduction might help explain why the Kellanova share price has been weak.
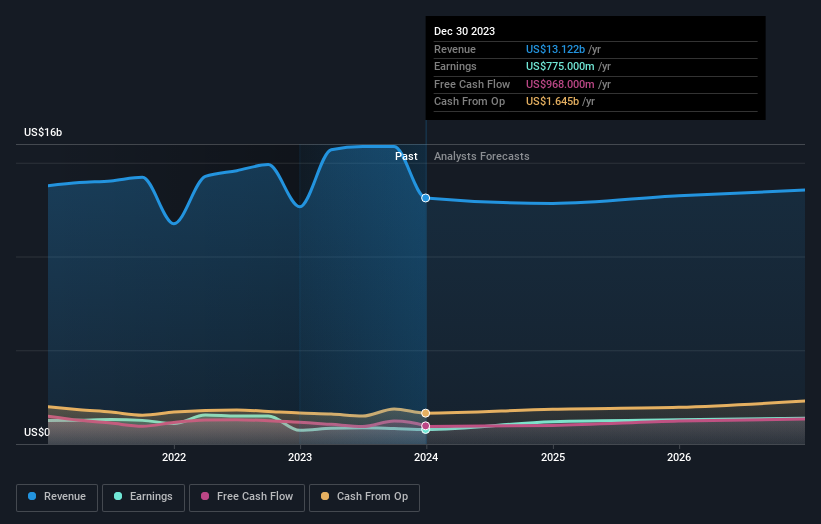
The company's revenue and earnings (over time) are depicted in the image below (click to see the exact numbers).
Kellanova is well known by investors, and plenty of clever analysts have tried to predict the future profit levels. So we recommend checking out this free report showing consensus forecasts
What About Dividends?
When looking at investment returns, it is important to consider the difference between total shareholder return (TSR) and share price return. Whereas the share price return only reflects the change in the share price, the TSR includes the value of dividends (assuming they were reinvested) and the benefit of any discounted capital raising or spin-off. Arguably, the TSR gives a more comprehensive picture of the return generated by a stock. As it happens, Kellanova's TSR for the last 1 year was -9.2%, which exceeds the share price return mentioned earlier. This is largely a result of its dividend payments!
A Different Perspective
While the broader market gained around 23% in the last year, Kellanova shareholders lost 9.2% (even including dividends). However, keep in mind that even the best stocks will sometimes underperform the market over a twelve month period. On the bright side, long term shareholders have made money, with a gain of 4% per year over half a decade. It could be that the recent sell-off is an opportunity, so it may be worth checking the fundamental data for signs of a long term growth trend. It's always interesting to track share price performance over the longer term. But to understand Kellanova better, we need to consider many other factors. Take risks, for example - Kellanova has 2 warning signs we think you should be aware of.
But note: Kellanova may not be the best stock to buy. So take a peek at this free list of interesting companies with past earnings growth (and further growth forecast).
Please note, the market returns quoted in this article reflect the market weighted average returns of stocks that currently trade on American exchanges.
Valuation is complex, but we're helping make it simple.
Find out whether Kellanova is potentially over or undervalued by checking out our comprehensive analysis, which includes fair value estimates, risks and warnings, dividends, insider transactions and financial health.
View the Free AnalysisHave feedback on this article? Concerned about the content? Get in touch with us directly. Alternatively, email editorial-team (at) simplywallst.com.
This article by Simply Wall St is general in nature. We provide commentary based on historical data and analyst forecasts only using an unbiased methodology and our articles are not intended to be financial advice. It does not constitute a recommendation to buy or sell any stock, and does not take account of your objectives, or your financial situation. We aim to bring you long-term focused analysis driven by fundamental data. Note that our analysis may not factor in the latest price-sensitive company announcements or qualitative material. Simply Wall St has no position in any stocks mentioned.

Simply Wall St
About NYSE:K
Kellanova
Kellanova, together with its subsidiaries, manufactures and markets snacks and convenience foods in North America, Europe, Latin America, the Asia Pacific, the Middle East, Australia, and Africa.
Average dividend payer with acceptable track record.
