Stock Analysis
- United States
- /
- Diversified Financial
- /
- NYSE:RDN
Investors in Radian Group (NYSE:RDN) have seen notable returns of 57% over the past year


Passive investing in index funds can generate returns that roughly match the overall market. But one can do better than that by picking better than average stocks (as part of a diversified portfolio). For example, the Radian Group Inc. (NYSE:RDN) share price is up 51% in the last 1 year, clearly besting the market return of around 26% (not including dividends). That's a solid performance by our standards! Also impressive, the stock is up 42% over three years, making long term shareholders happy, too.
Now it's worth having a look at the company's fundamentals too, because that will help us determine if the long term shareholder return has matched the performance of the underlying business.
View our latest analysis for Radian Group
To paraphrase Benjamin Graham: Over the short term the market is a voting machine, but over the long term it's a weighing machine. One way to examine how market sentiment has changed over time is to look at the interaction between a company's share price and its earnings per share (EPS).
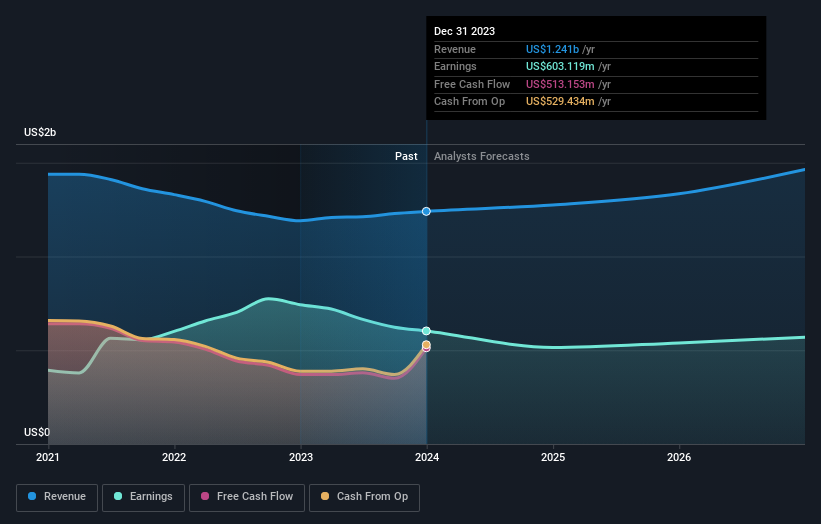
During the last year, Radian Group actually saw its earnings per share drop 14%.
This means it's unlikely the market is judging the company based on earnings growth. Indeed, when EPS is declining but the share price is up, it often means the market is considering other factors.
We think that the revenue growth of 4.2% could have some investors interested. Many businesses do go through a phase where they have to forgo some profits to drive business development, and sometimes its for the best.
The company's revenue and earnings (over time) are depicted in the image below (click to see the exact numbers).
This free interactive report on Radian Group's balance sheet strength is a great place to start, if you want to investigate the stock further.
What About Dividends?
As well as measuring the share price return, investors should also consider the total shareholder return (TSR). Whereas the share price return only reflects the change in the share price, the TSR includes the value of dividends (assuming they were reinvested) and the benefit of any discounted capital raising or spin-off. It's fair to say that the TSR gives a more complete picture for stocks that pay a dividend. As it happens, Radian Group's TSR for the last 1 year was 57%, which exceeds the share price return mentioned earlier. This is largely a result of its dividend payments!
A Different Perspective
It's good to see that Radian Group has rewarded shareholders with a total shareholder return of 57% in the last twelve months. That's including the dividend. That's better than the annualised return of 11% over half a decade, implying that the company is doing better recently. Someone with an optimistic perspective could view the recent improvement in TSR as indicating that the business itself is getting better with time. It's always interesting to track share price performance over the longer term. But to understand Radian Group better, we need to consider many other factors. Case in point: We've spotted 1 warning sign for Radian Group you should be aware of.
Of course, you might find a fantastic investment by looking elsewhere. So take a peek at this free list of companies we expect will grow earnings.
Please note, the market returns quoted in this article reflect the market weighted average returns of stocks that currently trade on American exchanges.
Valuation is complex, but we're helping make it simple.
Find out whether Radian Group is potentially over or undervalued by checking out our comprehensive analysis, which includes fair value estimates, risks and warnings, dividends, insider transactions and financial health.
View the Free AnalysisHave feedback on this article? Concerned about the content? Get in touch with us directly. Alternatively, email editorial-team (at) simplywallst.com.
This article by Simply Wall St is general in nature. We provide commentary based on historical data and analyst forecasts only using an unbiased methodology and our articles are not intended to be financial advice. It does not constitute a recommendation to buy or sell any stock, and does not take account of your objectives, or your financial situation. We aim to bring you long-term focused analysis driven by fundamental data. Note that our analysis may not factor in the latest price-sensitive company announcements or qualitative material. Simply Wall St has no position in any stocks mentioned.
About NYSE:RDN
Radian Group
Engages in the mortgage and real estate services business in the United States.
Undervalued established dividend payer.

