Stock Analysis
- United States
- /
- Capital Markets
- /
- NYSE:BK
Investing in Bank of New York Mellon (NYSE:BK) three years ago would have delivered you a 40% gain

By buying an index fund, investors can approximate the average market return. But if you buy good businesses at attractive prices, your portfolio returns could exceed the average market return. Just take a look at The Bank of New York Mellon Corporation (NYSE:BK), which is up 27%, over three years, soundly beating the market return of 16% (not including dividends). On the other hand, the returns haven't been quite so good recently, with shareholders up just 14% , including dividends .
Now it's worth having a look at the company's fundamentals too, because that will help us determine if the long term shareholder return has matched the performance of the underlying business.
See our latest analysis for Bank of New York Mellon
To paraphrase Benjamin Graham: Over the short term the market is a voting machine, but over the long term it's a weighing machine. By comparing earnings per share (EPS) and share price changes over time, we can get a feel for how investor attitudes to a company have morphed over time.
During three years of share price growth, Bank of New York Mellon achieved compound earnings per share growth of 2.6% per year. This EPS growth is lower than the 8% average annual increase in the share price. So it's fair to assume the market has a higher opinion of the business than it did three years ago. It's not unusual to see the market 're-rate' a stock, after a few years of growth.
You can see below how EPS has changed over time (discover the exact values by clicking on the image).
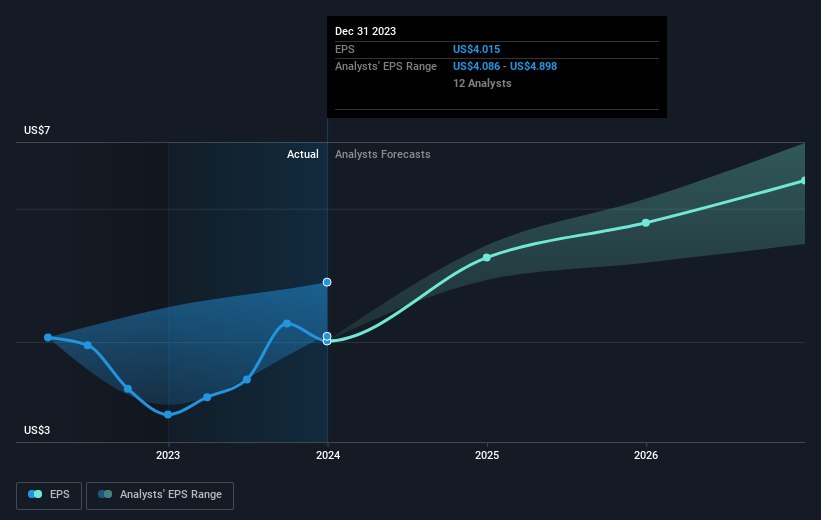
We know that Bank of New York Mellon has improved its bottom line lately, but is it going to grow revenue? This free report showing analyst revenue forecasts should help you figure out if the EPS growth can be sustained.
What About Dividends?
It is important to consider the total shareholder return, as well as the share price return, for any given stock. Whereas the share price return only reflects the change in the share price, the TSR includes the value of dividends (assuming they were reinvested) and the benefit of any discounted capital raising or spin-off. Arguably, the TSR gives a more comprehensive picture of the return generated by a stock. In the case of Bank of New York Mellon, it has a TSR of 40% for the last 3 years. That exceeds its share price return that we previously mentioned. This is largely a result of its dividend payments!
A Different Perspective
Bank of New York Mellon shareholders are up 14% for the year (even including dividends). But that was short of the market average. The silver lining is that the gain was actually better than the average annual return of 4% per year over five year. This suggests the company might be improving over time. It's always interesting to track share price performance over the longer term. But to understand Bank of New York Mellon better, we need to consider many other factors. Case in point: We've spotted 1 warning sign for Bank of New York Mellon you should be aware of.
If you are like me, then you will not want to miss this free list of growing companies that insiders are buying.
Please note, the market returns quoted in this article reflect the market weighted average returns of stocks that currently trade on American exchanges.
Valuation is complex, but we're helping make it simple.
Find out whether Bank of New York Mellon is potentially over or undervalued by checking out our comprehensive analysis, which includes fair value estimates, risks and warnings, dividends, insider transactions and financial health.
View the Free AnalysisHave feedback on this article? Concerned about the content? Get in touch with us directly. Alternatively, email editorial-team (at) simplywallst.com.
This article by Simply Wall St is general in nature. We provide commentary based on historical data and analyst forecasts only using an unbiased methodology and our articles are not intended to be financial advice. It does not constitute a recommendation to buy or sell any stock, and does not take account of your objectives, or your financial situation. We aim to bring you long-term focused analysis driven by fundamental data. Note that our analysis may not factor in the latest price-sensitive company announcements or qualitative material. Simply Wall St has no position in any stocks mentioned.
About NYSE:BK
Bank of New York Mellon
The Bank of New York Mellon Corporation provides a range of financial products and services in the United States and internationally.
Flawless balance sheet established dividend payer.

