Stock Analysis
- United States
- /
- Food and Staples Retail
- /
- NasdaqGS:SPTN
Declining Stock and Decent Financials: Is The Market Wrong About SpartanNash Company (NASDAQ:SPTN)?

SpartanNash (NASDAQ:SPTN) has had a rough month with its share price down 7.6%. However, stock prices are usually driven by a company’s financials over the long term, which in this case look pretty respectable. Specifically, we decided to study SpartanNash's ROE in this article.
Return on Equity or ROE is a test of how effectively a company is growing its value and managing investors’ money. Simply put, it is used to assess the profitability of a company in relation to its equity capital.
View our latest analysis for SpartanNash
How Do You Calculate Return On Equity?
Return on equity can be calculated by using the formula:
Return on Equity = Net Profit (from continuing operations) ÷ Shareholders' Equity
So, based on the above formula, the ROE for SpartanNash is:
5.5% = US$43m ÷ US$777m (Based on the trailing twelve months to October 2023).
The 'return' is the income the business earned over the last year. That means that for every $1 worth of shareholders' equity, the company generated $0.05 in profit.
What Has ROE Got To Do With Earnings Growth?
Thus far, we have learned that ROE measures how efficiently a company is generating its profits. We now need to evaluate how much profit the company reinvests or "retains" for future growth which then gives us an idea about the growth potential of the company. Generally speaking, other things being equal, firms with a high return on equity and profit retention, have a higher growth rate than firms that don’t share these attributes.
A Side By Side comparison of SpartanNash's Earnings Growth And 5.5% ROE
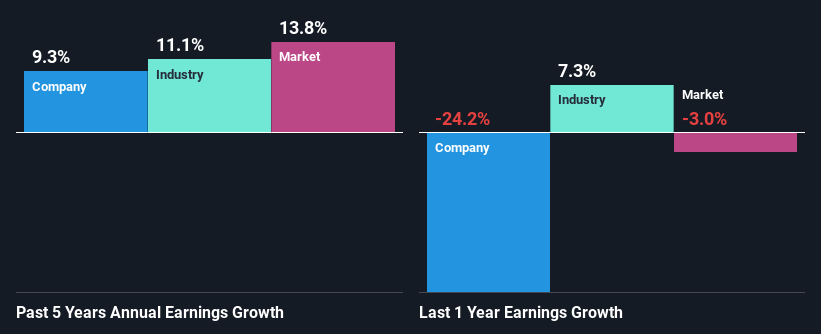
On the face of it, SpartanNash's ROE is not much to talk about. A quick further study shows that the company's ROE doesn't compare favorably to the industry average of 15% either. However, the moderate 9.3% net income growth seen by SpartanNash over the past five years is definitely a positive. So, the growth in the company's earnings could probably have been caused by other variables. Such as - high earnings retention or an efficient management in place.
We then performed a comparison between SpartanNash's net income growth with the industry, which revealed that the company's growth is similar to the average industry growth of 11% in the same 5-year period.
Earnings growth is an important metric to consider when valuing a stock. The investor should try to establish if the expected growth or decline in earnings, whichever the case may be, is priced in. This then helps them determine if the stock is placed for a bright or bleak future. One good indicator of expected earnings growth is the P/E ratio which determines the price the market is willing to pay for a stock based on its earnings prospects. So, you may want to check if SpartanNash is trading on a high P/E or a low P/E, relative to its industry.
Is SpartanNash Making Efficient Use Of Its Profits?
With a three-year median payout ratio of 46% (implying that the company retains 54% of its profits), it seems that SpartanNash is reinvesting efficiently in a way that it sees respectable amount growth in its earnings and pays a dividend that's well covered.
Moreover, SpartanNash is determined to keep sharing its profits with shareholders which we infer from its long history of paying a dividend for at least ten years. Existing analyst estimates suggest that the company's future payout ratio is expected to drop to 32% over the next three years.
Summary
In total, it does look like SpartanNash has some positive aspects to its business. Even in spite of the low rate of return, the company has posted impressive earnings growth as a result of reinvesting heavily into its business. Having said that, looking at the current analyst estimates, we found that the company's earnings are expected to gain momentum. To know more about the latest analysts predictions for the company, check out this visualization of analyst forecasts for the company.
Valuation is complex, but we're helping make it simple.
Find out whether SpartanNash is potentially over or undervalued by checking out our comprehensive analysis, which includes fair value estimates, risks and warnings, dividends, insider transactions and financial health.
View the Free AnalysisHave feedback on this article? Concerned about the content? Get in touch with us directly. Alternatively, email editorial-team (at) simplywallst.com.
This article by Simply Wall St is general in nature. We provide commentary based on historical data and analyst forecasts only using an unbiased methodology and our articles are not intended to be financial advice. It does not constitute a recommendation to buy or sell any stock, and does not take account of your objectives, or your financial situation. We aim to bring you long-term focused analysis driven by fundamental data. Note that our analysis may not factor in the latest price-sensitive company announcements or qualitative material. Simply Wall St has no position in any stocks mentioned.
About NasdaqGS:SPTN
SpartanNash
SpartanNash Company distributes and retails grocery products in the United States of America.
Very undervalued with proven track record and pays a dividend.

