- United States
- /
- Consumer Durables
- /
- NYSE:WOR
Worthington Enterprises' (NYSE:WOR) investors will be pleased with their splendid 157% return over the last five years


The main point of investing for the long term is to make money. Furthermore, you'd generally like to see the share price rise faster than the market. Unfortunately for shareholders, while the Worthington Enterprises, Inc. (NYSE:WOR) share price is up 42% in the last five years, that's less than the market return. However, if you include the dividends then the return is market beating. The last year has been disappointing, with the stock price down 1.7% in that time.
Now it's worth having a look at the company's fundamentals too, because that will help us determine if the long term shareholder return has matched the performance of the underlying business.
See our latest analysis for Worthington Enterprises
While the efficient markets hypothesis continues to be taught by some, it has been proven that markets are over-reactive dynamic systems, and investors are not always rational. One flawed but reasonable way to assess how sentiment around a company has changed is to compare the earnings per share (EPS) with the share price.
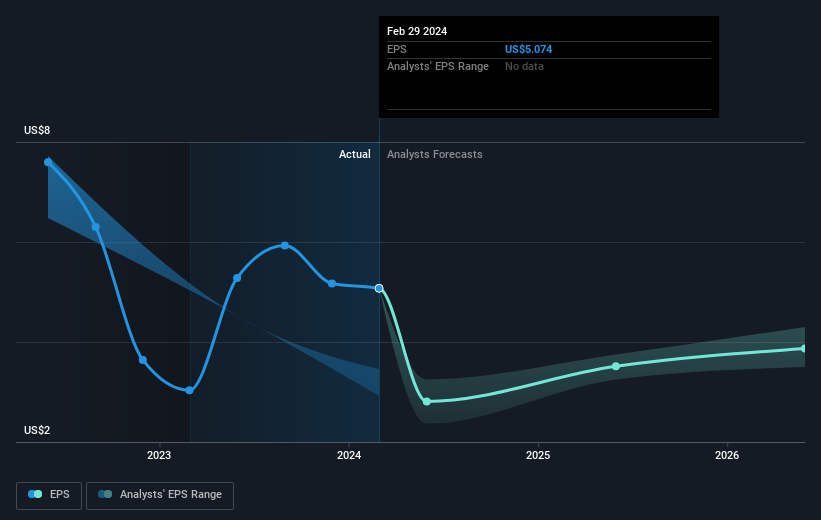
Over half a decade, Worthington Enterprises managed to grow its earnings per share at 14% a year. The EPS growth is more impressive than the yearly share price gain of 7% over the same period. Therefore, it seems the market has become relatively pessimistic about the company. The reasonably low P/E ratio of 11.78 also suggests market apprehension.
The graphic below depicts how EPS has changed over time (unveil the exact values by clicking on the image).
We know that Worthington Enterprises has improved its bottom line lately, but is it going to grow revenue? If you're interested, you could check this free report showing consensus revenue forecasts.
What About Dividends?
As well as measuring the share price return, investors should also consider the total shareholder return (TSR). The TSR is a return calculation that accounts for the value of cash dividends (assuming that any dividend received was reinvested) and the calculated value of any discounted capital raisings and spin-offs. So for companies that pay a generous dividend, the TSR is often a lot higher than the share price return. We note that for Worthington Enterprises the TSR over the last 5 years was 157%, which is better than the share price return mentioned above. This is largely a result of its dividend payments!
A Different Perspective
We're pleased to report that Worthington Enterprises shareholders have received a total shareholder return of 62% over one year. And that does include the dividend. That's better than the annualised return of 21% over half a decade, implying that the company is doing better recently. In the best case scenario, this may hint at some real business momentum, implying that now could be a great time to delve deeper. I find it very interesting to look at share price over the long term as a proxy for business performance. But to truly gain insight, we need to consider other information, too. To that end, you should learn about the 3 warning signs we've spotted with Worthington Enterprises (including 1 which is significant) .
For those who like to find winning investments this free list of growing companies with recent insider purchasing, could be just the ticket.
Please note, the market returns quoted in this article reflect the market weighted average returns of stocks that currently trade on American exchanges.
Valuation is complex, but we're here to simplify it.
Discover if Worthington Enterprises might be undervalued or overvalued with our detailed analysis, featuring fair value estimates, potential risks, dividends, insider trades, and its financial condition.
Access Free AnalysisHave feedback on this article? Concerned about the content? Get in touch with us directly. Alternatively, email editorial-team (at) simplywallst.com.
This article by Simply Wall St is general in nature. We provide commentary based on historical data and analyst forecasts only using an unbiased methodology and our articles are not intended to be financial advice. It does not constitute a recommendation to buy or sell any stock, and does not take account of your objectives, or your financial situation. We aim to bring you long-term focused analysis driven by fundamental data. Note that our analysis may not factor in the latest price-sensitive company announcements or qualitative material. Simply Wall St has no position in any stocks mentioned.
About NYSE:WOR
Excellent balance sheet with moderate growth potential.

