Stock Analysis
- United States
- /
- Luxury
- /
- NasdaqGS:LULU
Declining Stock and Solid Fundamentals: Is The Market Wrong About Lululemon Athletica Inc. (NASDAQ:LULU)?

It is hard to get excited after looking at Lululemon Athletica's (NASDAQ:LULU) recent performance, when its stock has declined 20% over the past three months. However, stock prices are usually driven by a company’s financial performance over the long term, which in this case looks quite promising. Particularly, we will be paying attention to Lululemon Athletica's ROE today.
ROE or return on equity is a useful tool to assess how effectively a company can generate returns on the investment it received from its shareholders. Simply put, it is used to assess the profitability of a company in relation to its equity capital.
See our latest analysis for Lululemon Athletica
How Is ROE Calculated?
Return on equity can be calculated by using the formula:
Return on Equity = Net Profit (from continuing operations) ÷ Shareholders' Equity
So, based on the above formula, the ROE for Lululemon Athletica is:
37% = US$1.6b ÷ US$4.2b (Based on the trailing twelve months to January 2024).
The 'return' refers to a company's earnings over the last year. Another way to think of that is that for every $1 worth of equity, the company was able to earn $0.37 in profit.
Why Is ROE Important For Earnings Growth?
So far, we've learned that ROE is a measure of a company's profitability. Based on how much of its profits the company chooses to reinvest or "retain", we are then able to evaluate a company's future ability to generate profits. Generally speaking, other things being equal, firms with a high return on equity and profit retention, have a higher growth rate than firms that don’t share these attributes.
Lululemon Athletica's Earnings Growth And 37% ROE
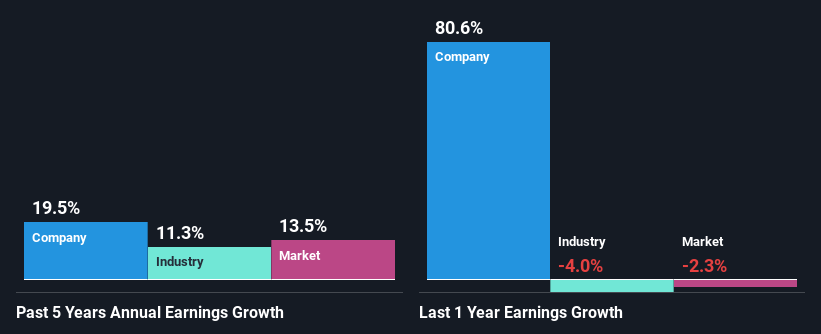
First thing first, we like that Lululemon Athletica has an impressive ROE. Second, a comparison with the average ROE reported by the industry of 13% also doesn't go unnoticed by us. Probably as a result of this, Lululemon Athletica was able to see a decent net income growth of 20% over the last five years.
We then compared Lululemon Athletica's net income growth with the industry and we're pleased to see that the company's growth figure is higher when compared with the industry which has a growth rate of 11% in the same 5-year period.
The basis for attaching value to a company is, to a great extent, tied to its earnings growth. What investors need to determine next is if the expected earnings growth, or the lack of it, is already built into the share price. This then helps them determine if the stock is placed for a bright or bleak future. Is LULU fairly valued? This infographic on the company's intrinsic value has everything you need to know.
Is Lululemon Athletica Using Its Retained Earnings Effectively?
Given that Lululemon Athletica doesn't pay any dividend to its shareholders, we infer that the company has been reinvesting all of its profits to grow its business.
Summary
Overall, we are quite pleased with Lululemon Athletica's performance. Particularly, we like that the company is reinvesting heavily into its business, and at a high rate of return. Unsurprisingly, this has led to an impressive earnings growth. That being so, a study of the latest analyst forecasts show that the company is expected to see a slowdown in its future earnings growth. To know more about the latest analysts predictions for the company, check out this visualization of analyst forecasts for the company.
Valuation is complex, but we're helping make it simple.
Find out whether Lululemon Athletica is potentially over or undervalued by checking out our comprehensive analysis, which includes fair value estimates, risks and warnings, dividends, insider transactions and financial health.
View the Free AnalysisHave feedback on this article? Concerned about the content? Get in touch with us directly. Alternatively, email editorial-team (at) simplywallst.com.
This article by Simply Wall St is general in nature. We provide commentary based on historical data and analyst forecasts only using an unbiased methodology and our articles are not intended to be financial advice. It does not constitute a recommendation to buy or sell any stock, and does not take account of your objectives, or your financial situation. We aim to bring you long-term focused analysis driven by fundamental data. Note that our analysis may not factor in the latest price-sensitive company announcements or qualitative material. Simply Wall St has no position in any stocks mentioned.
About NasdaqGS:LULU
Lululemon Athletica
Lululemon Athletica Inc., together with its subsidiaries, designs, distributes, and retails athletic apparel, footwear, and accessories under the lululemon brand for women and men.
Outstanding track record with flawless balance sheet.

