Stock Analysis
- United States
- /
- Professional Services
- /
- NYSE:BR
Investors in Broadridge Financial Solutions (NYSE:BR) have seen notable returns of 80% over the past five years


When you buy and hold a stock for the long term, you definitely want it to provide a positive return. But more than that, you probably want to see it rise more than the market average. Unfortunately for shareholders, while the Broadridge Financial Solutions, Inc. (NYSE:BR) share price is up 65% in the last five years, that's less than the market return. Some buyers are laughing, though, with an increase of 34% in the last year.
With that in mind, it's worth seeing if the company's underlying fundamentals have been the driver of long term performance, or if there are some discrepancies.
Check out our latest analysis for Broadridge Financial Solutions
While markets are a powerful pricing mechanism, share prices reflect investor sentiment, not just underlying business performance. One flawed but reasonable way to assess how sentiment around a company has changed is to compare the earnings per share (EPS) with the share price.
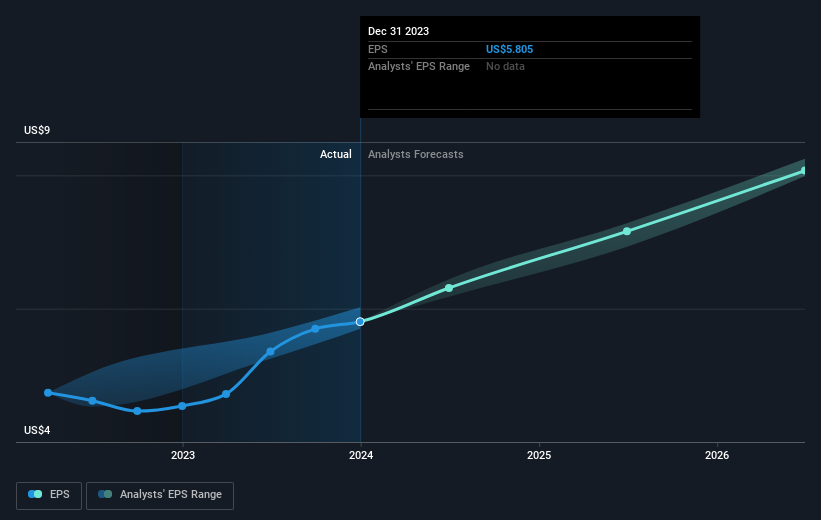
Over half a decade, Broadridge Financial Solutions managed to grow its earnings per share at 8.9% a year. So the EPS growth rate is rather close to the annualized share price gain of 11% per year. That suggests that the market sentiment around the company hasn't changed much over that time. In fact, the share price seems to largely reflect the EPS growth.
You can see how EPS has changed over time in the image below (click on the chart to see the exact values).
We know that Broadridge Financial Solutions has improved its bottom line lately, but is it going to grow revenue? Check if analysts think Broadridge Financial Solutions will grow revenue in the future.
What About Dividends?
As well as measuring the share price return, investors should also consider the total shareholder return (TSR). Whereas the share price return only reflects the change in the share price, the TSR includes the value of dividends (assuming they were reinvested) and the benefit of any discounted capital raising or spin-off. Arguably, the TSR gives a more comprehensive picture of the return generated by a stock. We note that for Broadridge Financial Solutions the TSR over the last 5 years was 80%, which is better than the share price return mentioned above. This is largely a result of its dividend payments!
A Different Perspective
We're pleased to report that Broadridge Financial Solutions shareholders have received a total shareholder return of 36% over one year. That's including the dividend. Since the one-year TSR is better than the five-year TSR (the latter coming in at 12% per year), it would seem that the stock's performance has improved in recent times. Given the share price momentum remains strong, it might be worth taking a closer look at the stock, lest you miss an opportunity. It's always interesting to track share price performance over the longer term. But to understand Broadridge Financial Solutions better, we need to consider many other factors. To that end, you should be aware of the 2 warning signs we've spotted with Broadridge Financial Solutions .
We will like Broadridge Financial Solutions better if we see some big insider buys. While we wait, check out this free list of growing companies with considerable, recent, insider buying.
Please note, the market returns quoted in this article reflect the market weighted average returns of stocks that currently trade on American exchanges.
Valuation is complex, but we're helping make it simple.
Find out whether Broadridge Financial Solutions is potentially over or undervalued by checking out our comprehensive analysis, which includes fair value estimates, risks and warnings, dividends, insider transactions and financial health.
View the Free AnalysisHave feedback on this article? Concerned about the content? Get in touch with us directly. Alternatively, email editorial-team (at) simplywallst.com.
This article by Simply Wall St is general in nature. We provide commentary based on historical data and analyst forecasts only using an unbiased methodology and our articles are not intended to be financial advice. It does not constitute a recommendation to buy or sell any stock, and does not take account of your objectives, or your financial situation. We aim to bring you long-term focused analysis driven by fundamental data. Note that our analysis may not factor in the latest price-sensitive company announcements or qualitative material. Simply Wall St has no position in any stocks mentioned.
About NYSE:BR
Broadridge Financial Solutions
Broadridge Financial Solutions, Inc. provides investor communications and technology-driven solutions for the financial services industry.
Solid track record established dividend payer.
