Stock Analysis
- United States
- /
- Machinery
- /
- NYSE:GTLS
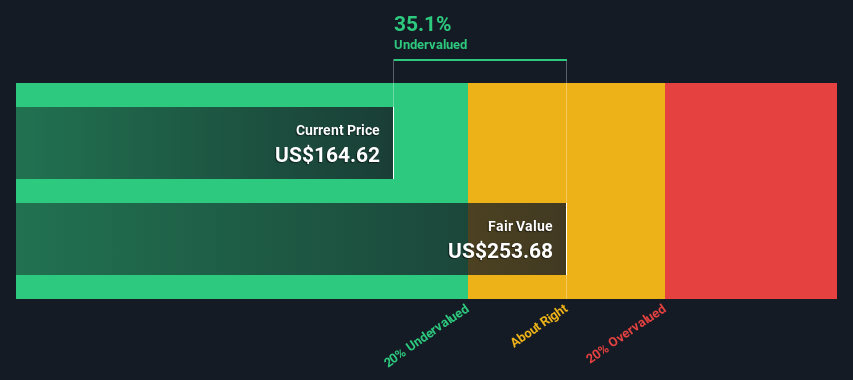
Are Investors Undervaluing Chart Industries, Inc. (NYSE:GTLS) By 35%?


Key Insights
- Chart Industries' estimated fair value is US$254 based on 2 Stage Free Cash Flow to Equity
- Chart Industries' US$165 share price signals that it might be 35% undervalued
- Our fair value estimate is 24% higher than Chart Industries' analyst price target of US$204
In this article we are going to estimate the intrinsic value of Chart Industries, Inc. (NYSE:GTLS) by projecting its future cash flows and then discounting them to today's value. The Discounted Cash Flow (DCF) model is the tool we will apply to do this. There's really not all that much to it, even though it might appear quite complex.
Remember though, that there are many ways to estimate a company's value, and a DCF is just one method. If you still have some burning questions about this type of valuation, take a look at the Simply Wall St analysis model.
View our latest analysis for Chart Industries
Crunching The Numbers
We are going to use a two-stage DCF model, which, as the name states, takes into account two stages of growth. The first stage is generally a higher growth period which levels off heading towards the terminal value, captured in the second 'steady growth' period. In the first stage we need to estimate the cash flows to the business over the next ten years. Where possible we use analyst estimates, but when these aren't available we extrapolate the previous free cash flow (FCF) from the last estimate or reported value. We assume companies with shrinking free cash flow will slow their rate of shrinkage, and that companies with growing free cash flow will see their growth rate slow, over this period. We do this to reflect that growth tends to slow more in the early years than it does in later years.
Generally we assume that a dollar today is more valuable than a dollar in the future, so we discount the value of these future cash flows to their estimated value in today's dollars:
10-year free cash flow (FCF) estimate
| 2024 | 2025 | 2026 | 2027 | 2028 | 2029 | 2030 | 2031 | 2032 | 2033 | |
| Levered FCF ($, Millions) | US$509.9m | US$648.6m | US$647.0m | US$713.5m | US$763.0m | US$805.1m | US$841.3m | US$873.2m | US$902.0m | US$928.7m |
| Growth Rate Estimate Source | Analyst x9 | Analyst x6 | Analyst x2 | Analyst x2 | Est @ 6.94% | Est @ 5.51% | Est @ 4.50% | Est @ 3.79% | Est @ 3.30% | Est @ 2.96% |
| Present Value ($, Millions) Discounted @ 8.9% | US$468 | US$547 | US$500 | US$507 | US$497 | US$482 | US$462 | US$440 | US$417 | US$394 |
("Est" = FCF growth rate estimated by Simply Wall St)
Present Value of 10-year Cash Flow (PVCF) = US$4.7b
After calculating the present value of future cash flows in the initial 10-year period, we need to calculate the Terminal Value, which accounts for all future cash flows beyond the first stage. For a number of reasons a very conservative growth rate is used that cannot exceed that of a country's GDP growth. In this case we have used the 5-year average of the 10-year government bond yield (2.2%) to estimate future growth. In the same way as with the 10-year 'growth' period, we discount future cash flows to today's value, using a cost of equity of 8.9%.
Terminal Value (TV)= FCF2033 × (1 + g) ÷ (r – g) = US$929m× (1 + 2.2%) ÷ (8.9%– 2.2%) = US$14b
Present Value of Terminal Value (PVTV)= TV / (1 + r)10= US$14b÷ ( 1 + 8.9%)10= US$5.9b
The total value, or equity value, is then the sum of the present value of the future cash flows, which in this case is US$11b. To get the intrinsic value per share, we divide this by the total number of shares outstanding. Compared to the current share price of US$165, the company appears quite undervalued at a 35% discount to where the stock price trades currently. The assumptions in any calculation have a big impact on the valuation, so it is better to view this as a rough estimate, not precise down to the last cent.
The Assumptions
The calculation above is very dependent on two assumptions. The first is the discount rate and the other is the cash flows. Part of investing is coming up with your own evaluation of a company's future performance, so try the calculation yourself and check your own assumptions. The DCF also does not consider the possible cyclicality of an industry, or a company's future capital requirements, so it does not give a full picture of a company's potential performance. Given that we are looking at Chart Industries as potential shareholders, the cost of equity is used as the discount rate, rather than the cost of capital (or weighted average cost of capital, WACC) which accounts for debt. In this calculation we've used 8.9%, which is based on a levered beta of 1.358. Beta is a measure of a stock's volatility, compared to the market as a whole. We get our beta from the industry average beta of globally comparable companies, with an imposed limit between 0.8 and 2.0, which is a reasonable range for a stable business.
SWOT Analysis for Chart Industries
- No major strengths identified for GTLS.
- Earnings declined over the past year.
- Interest payments on debt are not well covered.
- Shareholders have been diluted in the past year.
- Annual earnings are forecast to grow faster than the American market.
- Trading below our estimate of fair value by more than 20%.
- Debt is not well covered by operating cash flow.
Next Steps:
Whilst important, the DCF calculation shouldn't be the only metric you look at when researching a company. It's not possible to obtain a foolproof valuation with a DCF model. Preferably you'd apply different cases and assumptions and see how they would impact the company's valuation. For example, changes in the company's cost of equity or the risk free rate can significantly impact the valuation. What is the reason for the share price sitting below the intrinsic value? For Chart Industries, there are three pertinent items you should further examine:
- Risks: Consider for instance, the ever-present spectre of investment risk. We've identified 4 warning signs with Chart Industries (at least 1 which is a bit unpleasant) , and understanding them should be part of your investment process.
- Future Earnings: How does GTLS's growth rate compare to its peers and the wider market? Dig deeper into the analyst consensus number for the upcoming years by interacting with our free analyst growth expectation chart.
- Other High Quality Alternatives: Do you like a good all-rounder? Explore our interactive list of high quality stocks to get an idea of what else is out there you may be missing!
PS. The Simply Wall St app conducts a discounted cash flow valuation for every stock on the NYSE every day. If you want to find the calculation for other stocks just search here.
Valuation is complex, but we're helping make it simple.
Find out whether Chart Industries is potentially over or undervalued by checking out our comprehensive analysis, which includes fair value estimates, risks and warnings, dividends, insider transactions and financial health.
View the Free AnalysisHave feedback on this article? Concerned about the content? Get in touch with us directly. Alternatively, email editorial-team (at) simplywallst.com.
This article by Simply Wall St is general in nature. We provide commentary based on historical data and analyst forecasts only using an unbiased methodology and our articles are not intended to be financial advice. It does not constitute a recommendation to buy or sell any stock, and does not take account of your objectives, or your financial situation. We aim to bring you long-term focused analysis driven by fundamental data. Note that our analysis may not factor in the latest price-sensitive company announcements or qualitative material. Simply Wall St has no position in any stocks mentioned.
About NYSE:GTLS
Chart Industries
Chart Industries, Inc. engages in the designing, engineering, and manufacturing of process technologies and equipment for the gas and liquid molecules in the United States and internationally.
Undervalued with reasonable growth potential.
