
Advertisement
- United States
- /
- Electrical
- /
- NYSE:EAF
It's Down 27% But GrafTech International Ltd. (NYSE:EAF) Could Be Riskier Than It Looks
GrafTech International Ltd. (NYSE:EAF) shareholders won't be pleased to see that the share price has had a very rough month, dropping 27% and undoing the prior period's positive performance. The drop over the last 30 days has capped off a tough year for shareholders, with the share price down 42% in that time.
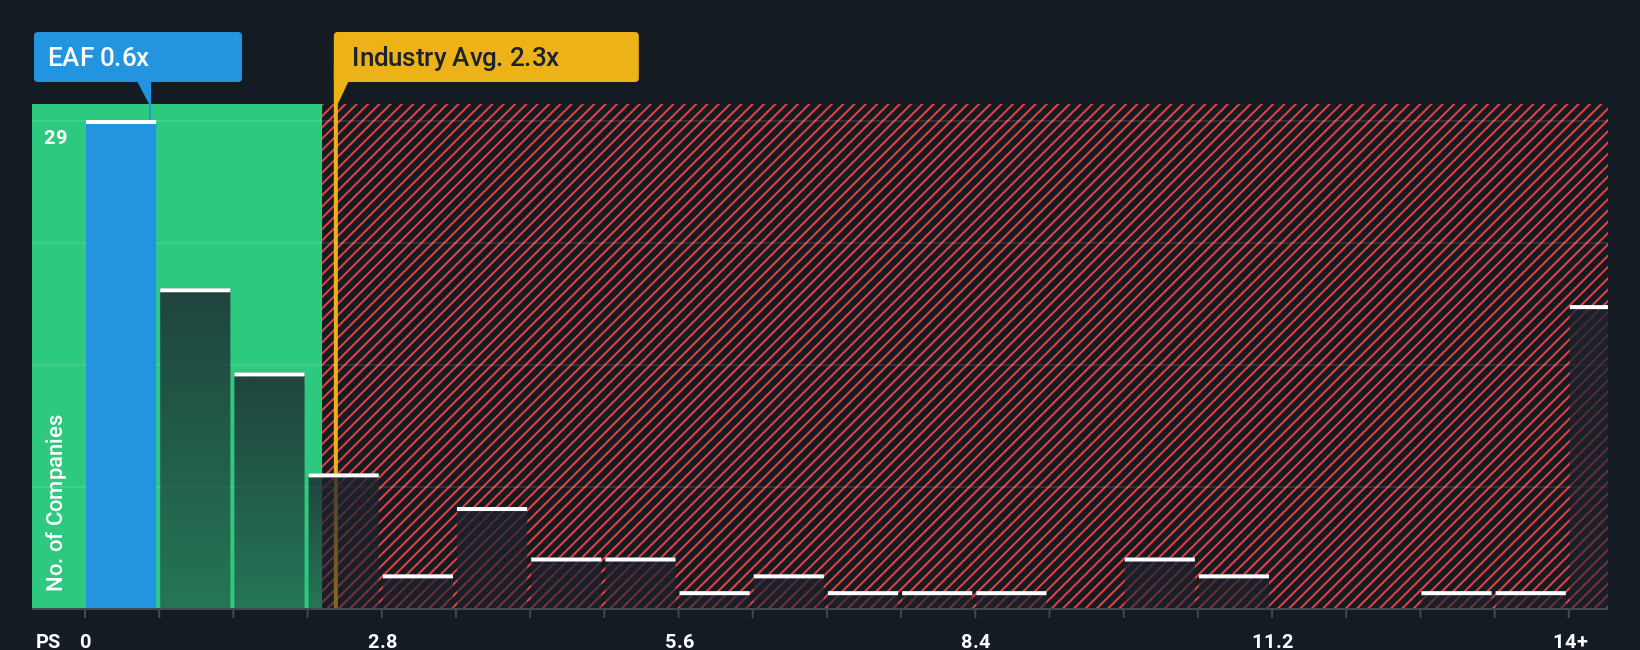
Since its price has dipped substantially, GrafTech International's price-to-sales (or "P/S") ratio of 0.6x might make it look like a buy right now compared to the Electrical industry in the United States, where around half of the companies have P/S ratios above 2.3x and even P/S above 7x are quite common. However, the P/S might be low for a reason and it requires further investigation to determine if it's justified.
See our latest analysis for GrafTech International
How GrafTech International Has Been Performing
While the industry has experienced revenue growth lately, GrafTech International's revenue has gone into reverse gear, which is not great. The P/S ratio is probably low because investors think this poor revenue performance isn't going to get any better. If you still like the company, you'd be hoping this isn't the case so that you could potentially pick up some stock while it's out of favour.
Keen to find out how analysts think GrafTech International's future stacks up against the industry? In that case, our free report is a great place to start.Is There Any Revenue Growth Forecasted For GrafTech International?
GrafTech International's P/S ratio would be typical for a company that's only expected to deliver limited growth, and importantly, perform worse than the industry.
Retrospectively, the last year delivered a frustrating 3.7% decrease to the company's top line. As a result, revenue from three years ago have also fallen 63% overall. Accordingly, shareholders would have felt downbeat about the medium-term rates of revenue growth.
Turning to the outlook, the next year should generate growth of 14% as estimated by the four analysts watching the company. That's shaping up to be similar to the 13% growth forecast for the broader industry.
With this in consideration, we find it intriguing that GrafTech International's P/S is lagging behind its industry peers. Apparently some shareholders are doubtful of the forecasts and have been accepting lower selling prices.
The Final Word
GrafTech International's recently weak share price has pulled its P/S back below other Electrical companies. It's argued the price-to-sales ratio is an inferior measure of value within certain industries, but it can be a powerful business sentiment indicator.
It looks to us like the P/S figures for GrafTech International remain low despite growth that is expected to be in line with other companies in the industry. When we see middle-of-the-road revenue growth like this, we assume it must be the potential risks that are what is placing pressure on the P/S ratio. At least the risk of a price drop looks to be subdued, but investors seem to think future revenue could see some volatility.
It is also worth noting that we have found 3 warning signs for GrafTech International (2 shouldn't be ignored!) that you need to take into consideration.
Of course, profitable companies with a history of great earnings growth are generally safer bets. So you may wish to see this free collection of other companies that have reasonable P/E ratios and have grown earnings strongly.
New: Manage All Your Stock Portfolios in One Place
We've created the ultimate portfolio companion for stock investors, and it's free.
• Connect an unlimited number of Portfolios and see your total in one currency
• Be alerted to new Warning Signs or Risks via email or mobile
• Track the Fair Value of your stocks
Have feedback on this article? Concerned about the content? Get in touch with us directly. Alternatively, email editorial-team (at) simplywallst.com.
This article by Simply Wall St is general in nature. We provide commentary based on historical data and analyst forecasts only using an unbiased methodology and our articles are not intended to be financial advice. It does not constitute a recommendation to buy or sell any stock, and does not take account of your objectives, or your financial situation. We aim to bring you long-term focused analysis driven by fundamental data. Note that our analysis may not factor in the latest price-sensitive company announcements or qualitative material. Simply Wall St has no position in any stocks mentioned.
About NYSE:EAF
GrafTech International
Research, develops, manufactures, and sells graphite and carbon-based solutions worldwide.
Fair value with low risk.
Similar Companies
Market Insights

Advertisement
Community Narratives
The company that turned a verb into a global necessity and basically runs the modern internet, digital ads, smartphones, maps, and AI.
Fair Value US$300.00|5.1% undervalued
OS
Community Contributor
Flowers Foods Pays A Fair Price For Health
Fair Value US$16.12|27.7% undervalued
NV
Community Contributor
TMX Group will thrive with 33.3% profit margin and enduring market moat
Fair Value CA$49.90|0.2% overvalued
LI
Community Contributor
The "Molecular Pencil": Why Beam's Technology is Built to Win
Fair Value US$65.01|64.4% undervalued
DA
Community Contributor