Advertisement
- United States
- /
- Construction
- /
- NYSE:DY
Is Now the Right Time to Reassess Dycom After Big Infrastructure Contract Win and 63% Rally?

Simply Wall St
Reviewed by Bailey Pemberton
- Wondering if Dycom Industries is trading at a bargain or if the market has already caught on? You’re not alone, and today we’ll dig into what the numbers are really saying.
- The stock has posted a substantial 62.9% gain so far this year and is up 64.3% over the past 12 months, but dipped slightly by -1.4% in the last week.
- Lately, shares have reacted to news around major contract wins. Dycom recently secured significant infrastructure work as the US ramps up broadband and 5G investment. Industry shifts and government funding have been in the spotlight, putting more attention on companies like Dycom that are positioned to benefit from long-term spending trends.
- On our six-point value assessment Dycom scores just 1 out of 6, showing the market does not consider most aspects of the company undervalued. We’ll explore these valuation approaches in a moment, but stick around for a smarter way to look at the true value story at the end.
Dycom Industries scores just 1/6 on our valuation checks. See what other red flags we found in the full valuation breakdown.
Approach 1: Dycom Industries Discounted Cash Flow (DCF) Analysis
The Discounted Cash Flow (DCF) approach estimates a company's fair value by projecting its future cash flows and discounting them back to today’s dollars. This method uses the idea that money is more valuable the sooner you receive it. For Dycom Industries, the model used looks at free cash flow forecasts and factors in both analyst estimates and long-term projections.
Currently, Dycom Industries has a trailing twelve-month Free Cash Flow (FCF) of $130.7 Million. Analyst projections forecast this growing to $218.85 Million by 2027. Further estimates suggest FCF could exceed $550 Million by 2035. While analyst inputs cover the next five years in detail, later years rely on extrapolations that suggest continued, but moderating, growth.
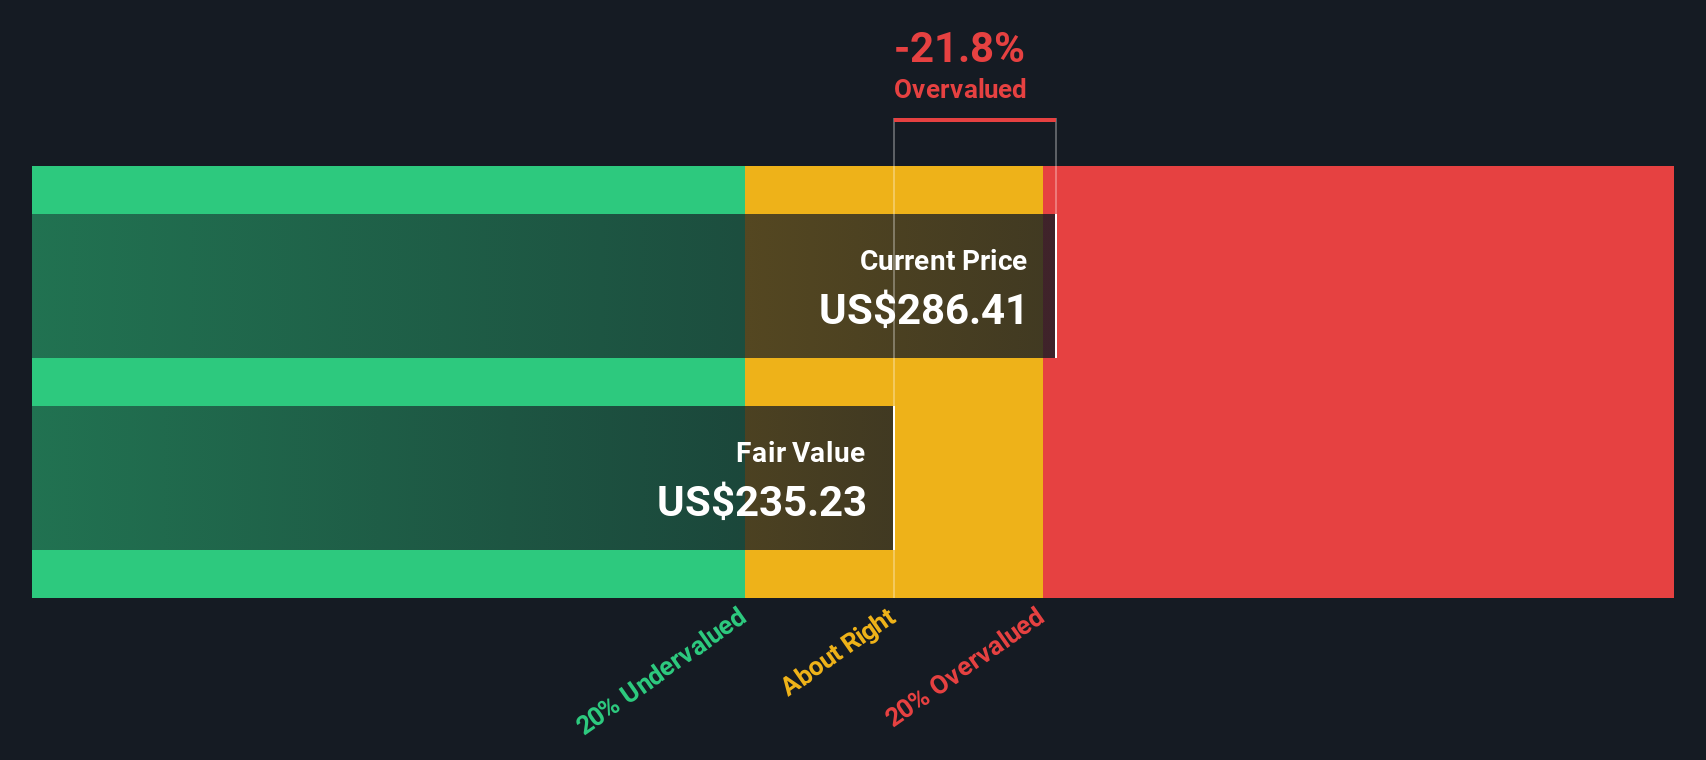
Based on this DCF model, Dycom's estimated intrinsic value is $240.44 per share. This figure is notably lower than the recent share price, which implies that the stock is trading at a 19.7% premium to its fair value. In other words, the DCF calculation suggests Dycom Industries is currently overvalued by the market, with investors paying up for expected future growth.
Result: OVERVALUED
Our Discounted Cash Flow (DCF) analysis suggests Dycom Industries may be overvalued by 19.7%. Discover 832 undervalued stocks or create your own screener to find better value opportunities.
Approach 2: Dycom Industries Price vs Earnings
The Price-to-Earnings (PE) ratio is a widely used valuation metric for companies like Dycom Industries that are profitable and have a steady stream of earnings. It gives investors a quick way to measure how much they're paying for each dollar of the company's earnings, making it especially useful when comparing similar businesses across an industry.
It is important to keep in mind that a company's PE ratio is influenced by factors such as expectations for future earnings growth and perceived risks. Faster-growing companies, or those with more stable and predictable profits, often command higher PE ratios. Businesses facing uncertainty may trade at lower multiples.
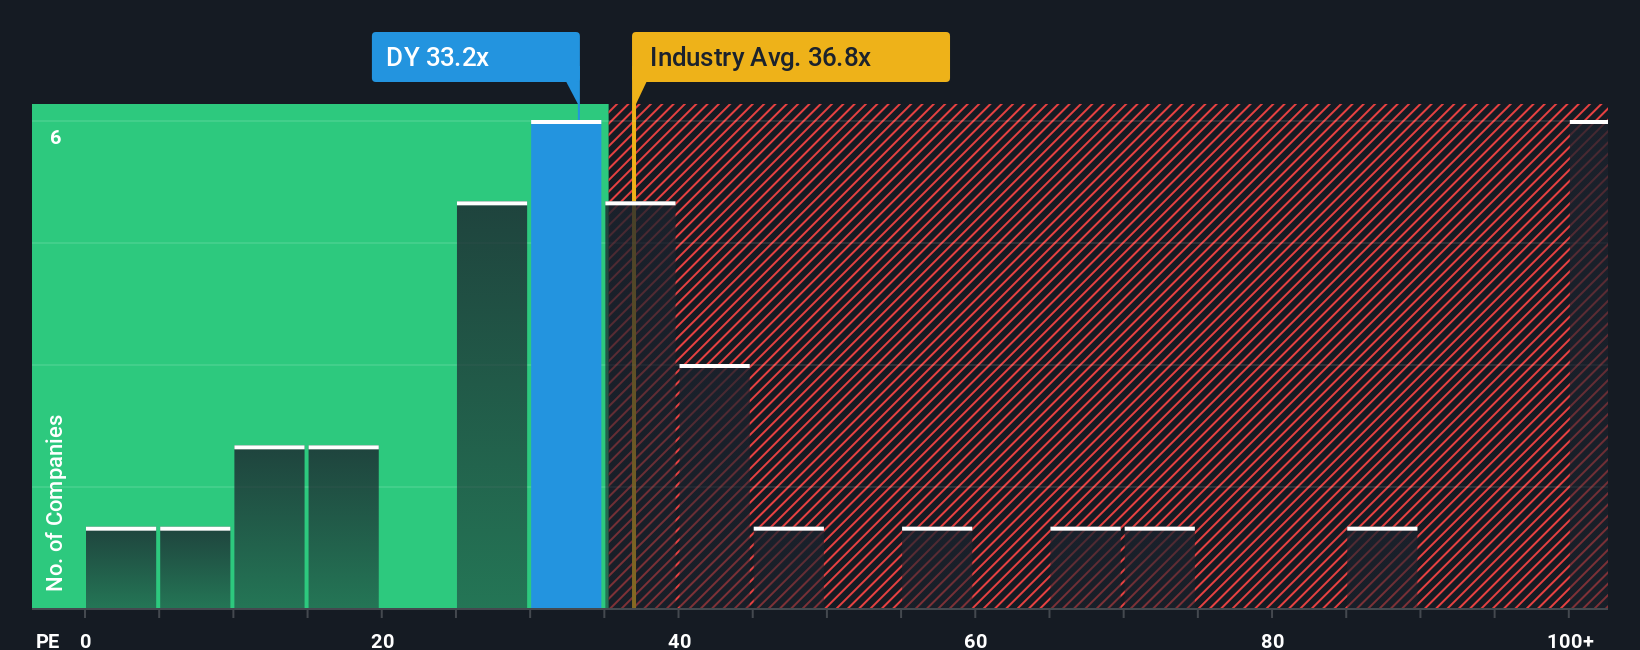
Currently, Dycom Industries trades at a PE ratio of 31.9x. This figure is a bit below the Construction industry average of 34.5x but above the average of its peers at 25.8x. However, Simply Wall St’s proprietary Fair Ratio for Dycom stands at 29.3x. The Fair Ratio is calculated by factoring in specific company-level details such as Dycom's profit margins, growth prospects, risk profile, business size, and industry environment. This makes it a more personalized benchmark than just relying on company peers or industry averages.
Because the Fair Ratio of 29.3x is very close to Dycom’s actual current PE of 31.9x, the stock appears to be priced about right based on earnings fundamentals.
Result: ABOUT RIGHT
PE ratios tell one story, but what if the real opportunity lies elsewhere? Discover 1410 companies where insiders are betting big on explosive growth.
Upgrade Your Decision Making: Choose your Dycom Industries Narrative
Earlier we mentioned that there is an even better way to understand valuation, so let's introduce you to Narratives. A Narrative is a simple, interactive way to articulate your personal view of a company by connecting the “story” you see, such as industry shifts or company strategies, to your own financial forecasts. These then flow directly into your fair value estimate.
Narratives are powerful because they let you move beyond just the raw numbers or market averages, linking your beliefs about Dycom Industries’s future (like revenue growth, margin expansion, or key risks) directly into financial models. This allows you to see, in real time, how your perspective compares with the market.
On Simply Wall St’s Community page, millions of investors use Narratives as an accessible tool to compare their investment logic, check their fair value against the latest share price, and see when it might be time to buy or sell.
Whenever major news or earnings releases occur, Narratives update automatically with the latest information, ensuring your perspective stays relevant and actionable.
For example, one investor might view Dycom as a massive long-term winner driven by double-digit revenue growth and margin expansion, justifying a fair value as high as $308 per share. Another might worry about customer concentration and industry risks, and see fair value closer to $240. You can easily build, compare, and refine your Dycom Industries story.
Do you think there's more to the story for Dycom Industries? Head over to our Community to see what others are saying!
This article by Simply Wall St is general in nature. We provide commentary based on historical data and analyst forecasts only using an unbiased methodology and our articles are not intended to be financial advice. It does not constitute a recommendation to buy or sell any stock, and does not take account of your objectives, or your financial situation. We aim to bring you long-term focused analysis driven by fundamental data. Note that our analysis may not factor in the latest price-sensitive company announcements or qualitative material. Simply Wall St has no position in any stocks mentioned.
New: Manage All Your Stock Portfolios in One Place
We've created the ultimate portfolio companion for stock investors, and it's free.
• Connect an unlimited number of Portfolios and see your total in one currency
• Be alerted to new Warning Signs or Risks via email or mobile
• Track the Fair Value of your stocks
Have feedback on this article? Concerned about the content? Get in touch with us directly. Alternatively, email editorial-team@simplywallst.com
About NYSE:DY
Dycom Industries
Provides specialty contracting services to the telecommunications infrastructure and utility industries in the United States.
Excellent balance sheet with questionable track record.
Similar Companies
Market Insights

Advertisement
Community Narratives
The "Molecular Pencil": Why Beam's Technology is Built to Win
Fair Value US$65.01|65.8% undervalued
DA
Community Contributor
The silent giant behind virtually every advanced chip powering AI, smartphones, and modern infrastructure.
Fair Value US$310.00|7.6% undervalued
OS
Community Contributor
ADP Stock: Solid Fundamentals, But AI Investments Test Its Margin Resilience
Fair Value US$387.77|34.5% undervalued
YI
Community Contributor